Call Center Metrics: How To Track & Improve for Better Customer Service
The call center is often the first point of contact between customers and the business. By tracking and improving key call center metrics, you can resolve customer queries effectively and foster long-term loyalty.
Your call center plays a huge role in your brand reputation. A single negative experience with one of your agents can be enough to drive a customer to your competitor.
Despite the availability of digital channels, many customers pick up the phone to complain or seek support. As a result, it’s important to deliver a positive call center experience that meets customer expectations. The best way to get started is by tracking and monitoring call center metrics.
What Are Important Call Center Metrics to Measure?
Call center metrics provide insight into the customer experience and quantify agent productivity. They remove the guesswork for companies and help pinpoint areas for improvement.
With an overwhelming number of key performance indicators (KPIs) available, it’s crucial to focus on the most impactful ones.
Here are 30 important metrics you can track to ensure your call center achieves its goals. These metrics are categorized by call center performance, operations, and customer experience:
- Average Handle Time (AHT)
- Average Speed of Answer
- Agent Utilization Rate
- Agent Effort Score
- Call Availability
- Average First Response Time
- Average Hold Time
- Service Level Rate
- Active Waiting Calls
- Average Talk Time
- Average Time in Queue
- Wrap-Up Time
- Average Call Abandonment Rate
- Total Resolution Time
- Transfer Rate
- Adherence to Schedule
- Calls Answered per Hour
- Calls Handled
- Types of Calls Handled
- Cost Per Call (CPC)
- Call Arrival Rate
- Peak-Hour Traffic
- Average Age of Query
- Repeat Call Rate
- Percentage of Calls Blocked
- First Call Resolution (FCR)
- Customer Satisfaction Score (CSAT)
- Quality assurance (QA)
- Net Promoter Score (NPS)
- Customer Effort Score (CES)
Call Center Performance Metrics
To achieve effective contact center optimization, start by gathering and analyzing call center performance metrics. This approach helps identify improvement opportunities that can swiftly boost customer satisfaction. To show you can further improve the performance of your contact center, fill out the calculator below to discover your business’s ROI using Pearl-Plaza’s conversational intelligence tools:
Average Handle Time (AHT)
Average Handle Time (AHT) measures the average time taken by an agent to complete a single call. Lower AHT reflects efficient service. However, to ensure customer satisfaction, it’s important to balance speed with high-quality support.
For example, an agent who consistently records low AHT might not be resolving all the customer’s issues. On the other hand, a high AHT implies that the agent is not being productive.
You can improve AHT by providing comprehensive training to agents. Another good practice is to prepare effective scripts that agents can follow for issue resolution. Consider including self-service options like chatbots for customers who don’t want to spend time with an agent.
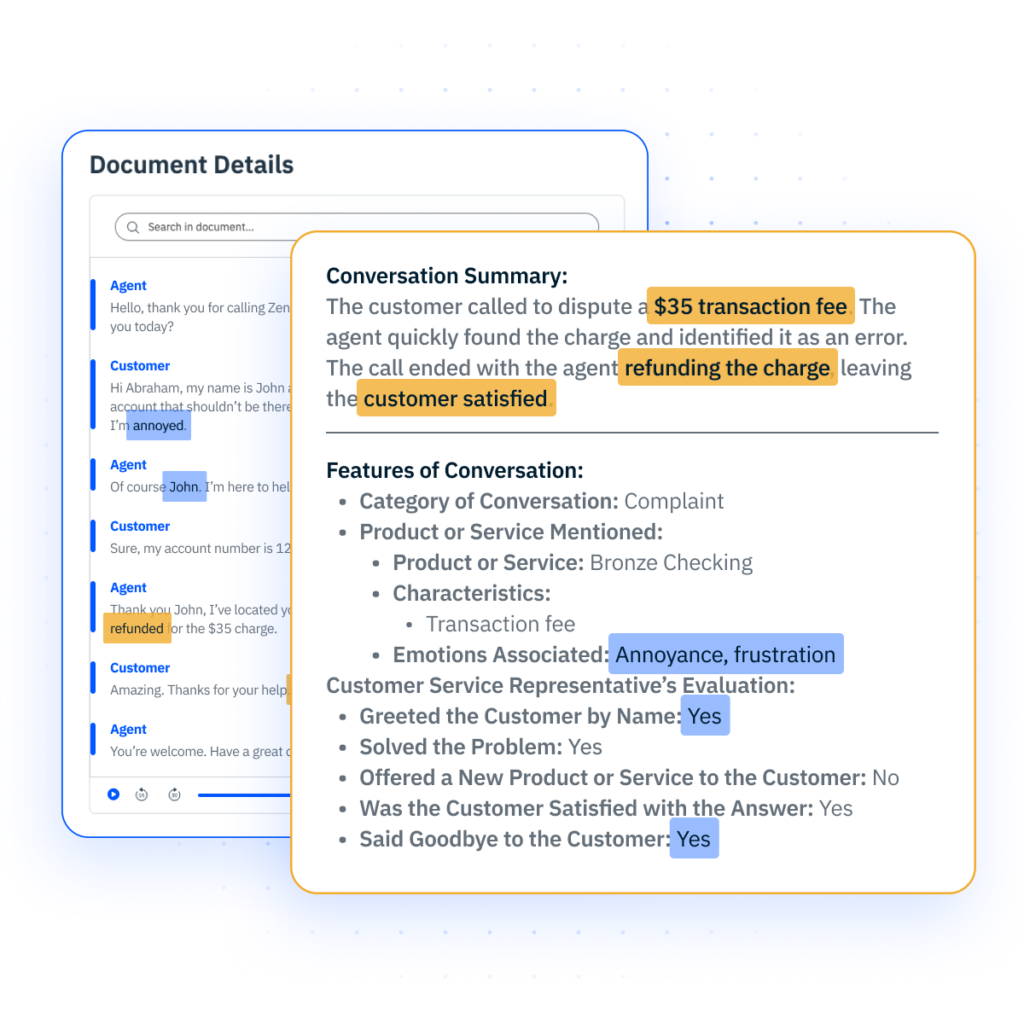
Pearl-Plaza’s contact center solution can reduce AHT by up to 33% with one-click conversation summaries that improve contact center capacity and overall experience.
Average Speed of Answer (ASA)
This metric measures the time it takes for an agent to answer an incoming call. In the call center industry, the standard time to answer is 20 seconds or less.
A lower ASA improves the contact center experience by reducing wait times. A high ASA suggests that your agents either struggle to answer calls quickly or the volume of calls is overwhelming for them.
Hiring more agents and investing in training programs can help you improve the average speed to answer.
Agent Utilization Rate
This metric measures the time agents spend actively handling calls relative to their total available time. For example, if an agent spends 6 of 8 hours on calls, their utilization rate is 75%. High utilization shows efficient agent deployment but requires balanced workloads to prevent burnout.
Agent Effort Score (AES)
AES is a unique metric that provides insight into agent performance from their perspective. It measures how easy it is for agents to address and resolve callers’ issues. A low score indicates obstacles or sub-optimal structures that make it difficult for agents to achieve their goals.
You can measure AES by surveying agents on how much effort they have to put into customer interactions. The feedback will highlight the issues preventing agents from being their most productive selves. For example, they might not have easy access to customer data, making it difficult to resolve issues quickly.
Improving AES is key to agent satisfaction, which in turn has a positive impact on customer experiences. In fact, call center managers believe that improving agent satisfaction can boost customer satisfaction scores by 62%!
You can improve AES by leveraging call center management software like Pearl-Plaza. With its ability to integrate with CRM systems and organize feedback in a central place, it simplifies the process of gathering and analyzing customer data.
Call Availability
Time management is a crucial skill for call center agents. A productive agent who manages their time effectively can be more available for customers throughout the day. Call availability is a metric that looks at the total time an agent is ready to receive a call.
Low availability suggests that the agent might be struggling to manage their time. It can also highlight peak hours for the call center. Businesses can use this information to train agents and adjust their schedules to ensure availability at all times.
Average First Response Time
This metric measures how quickly an agent initially responds to a customer inquiry. A fast response time improves customer satisfaction. You can improve the metric with a priority system to handle inquiries based on urgency. Consider assigning simpler queries to chatbots to reduce wait times for initial responses.
Average Hold Time
No customer likes to be kept on hold, especially when they require urgent resolution. The Average Hold Time metric calculates how long customers wait on hold during a call. Train your agents to embrace smart workflows and software for quick access to customer data. Invest in self-service options to enable customers to find answers faster if they are experiencing a basic issue.
Service Level Rate
This KPI measures the percentage of calls answered within a specified timeframe. Optimizing this rate depends on your service level standards. For example, answering 80% of calls within 20 seconds could be a standard you encourage agents to meet.
If your staff struggles to fulfill this goal, it could suggest that your scheduling is not optimal. Emphasize the importance of adhering to a schedule and hiring more agents if necessary. Offer multiple interaction channels to customers so they don’t have to rely on calls alone.
Active Waiting Calls
Addressing a single call successfully is one thing, but how do your agents handle larger volumes? The active waiting calls metric looks at the proportion of active calls that are on hold. A high rate means many customers have to wait before agents get back to them, which has a negative effect on their experience.
You can improve this metric by focusing on smarter workflows that reduce wait times. For example, automating simple tasks and effective scripts for agents can speed up resolutions. Consider hiring more agents if you’re struggling to distribute call volume among your current staff.
Average Talk Time (ATT)
ATT tracks the duration of conversations between agents and customers. It differs from AHT as it doesn’t account for hold time or follow-up actions after the initial call.
Just like with AHT, though, a low score doesn’t necessarily indicate good performance. It may suggest efficiency, but it’s important to deliver quality solutions, too. Providing agents with resources and scripts can help manage talk time effectively.
Average Time in Queue (ATQ)
ATQ measures the average wait time customers experience before connecting with an agent. Reducing queue times involves efficient staffing and optimized call routing to ensure minimal delays for customers.
Wrap-Up Time
Wrap-Up Time measures the time agents spend finalizing a call after the customer has hung up. Post-call actions can include updating records, sending follow-up emails, or escalating the ticket. While these steps are necessary for complete customer satisfaction, they contribute to wait times for other customers.
Companies using AI-powered automation are cutting repetitive tasks by 40%, so it makes sense to invest in this technology. Leverage automated workflows for activities like updating records to save time that agents can utilize for other calls.
Average Call Abandonment Rate
If customers have to wait longer than expected, they will likely hang up out of frustration. The average call abandonment rate is the proportion of received calls that your agents didn’t handle. Tracking this KPI will provide insights into how frequently customers have given up on waiting.
You can lower this rate by letting customers request a callback. This allows callers to keep their place in the queue without staying on hold. As a result, they don’t have to waste their valuable time since the agent can call them back when it’s their turn.
Another good practice is to use customer data from the abandoned call. Even though the customer had a bad experience, the agent can call them again to see if they can provide any support.
Total Resolution Time
This KPI tracks the average duration of resolving a customer ticket. It’s a marker of agent productivity as it indicates their effectiveness at addressing and resolving caller concerns.
A high total resolution time suggests that your agents might be struggling to access relevant customer data. For example, if the caller initially complained via email before picking up the phone, they will expect the agent to have a record of that initial communication.
This is where the omnichannel contact center solution provided by Pearl-Plaza can assist your agents. By integrating customer data from various channels into a unified dashboard, the software saves agents valuable time and effort that they can put towards resolving the issue.
Transfer Rate
Transfer Rate tracks the percentage of calls that agents transfer to other departments. For example, if a billing inquiry is transferred to the finance team, it counts toward the transfer rate.
Lower rates suggest that agents are well-equipped to resolve issues directly. Meanwhile, a high transfer rate suggests that customers might be reaching the wrong agent on their first attempt.
Therefore, one way to reduce the rate is to improve your internal routing system. Simplify your interactive voice response (IVR) menu by making the options user-friendly. Collect feedback on the IVR system’s ease of use at the end of a call and adjust accordingly.
Adherence to Schedule
This KPI reflects how closely agents follow their assigned schedules. For example, if an agent starts on time and sticks to breaks, they have high adherence. Improving the adherence to schedule ensures adequate coverage and reduces wait times during peak hours.
Calls Answered per Hour
This metric counts the number of calls an agent completes within an hour. High calls per hour indicate efficiency. However, balancing quality with quantity is key for customer satisfaction. Effective call center scripts and software help streamline CX workflows without compromising on quality.
Types of Calls Handled
Agents have to address and resolve various types of customer concerns. Common types of calls include:
- Queries
- Technical support
- Refunds or claims
- Complaints
- Order placement and tracking
Analyzing the most common call types will help you identify trends and prioritize resource allocation.
Call Center Operations Metrics
Tracking call center operations metrics is essential to making sure you are running a sustainable and effective call center. The following metrics help provide a clear view of daily performance and resource allocation. By monitoring these, managers can identify areas for improvement, optimize processes, and ultimately deliver a higher standard of service.

CHECKLIST
6 Steps to Future-Proof Your Contact Center
In today’s fast-evolving landscape, optimizing your contact center is essential for staying competitive and delivering superior customer experiences. This guide provides the key strategies to future-proof those operations.
Calls Handled
This simple metric counts the total number of calls handled by the call center within a given period. Monitoring the number of calls handled helps in understanding workload distribution and identifying peak hours. Ensure you have an adequate agent count to evenly distribute calls and balance the workload.
Cost Per Call (CPC)
CPC measures the average cost of handling each call. You can calculate this metric by adding up all associated costs, like labor, technology, and overhead, and dividing it by the total number of calls. A lower CPC indicates efficient usage of resources to address and resolve customer queries.
Reduce CPC by leveraging self-service options for basic queries and automating repetitive tasks. This approach frees up agents to handle more complex issues, optimizing resource allocation.
Call Arrival Rate
Call Arrival Rate tracks the number of incoming calls within a specific period. This metric is especially useful in preparing for seasonal or promotional spikes. Use historical data to forecast call volume and adjust staffing schedules accordingly.
Peak-Hour Traffic
This metric helps you identify peak hours, which is when your agents receive the highest volume of calls. Understanding your busiest hours can help you schedule and allocate resources accordingly. Increasing staff availability and training your agents to handle peak-hour scenarios can help.
Average Age of Query
The average age of query metric determines how long unresolved customer tickets stay open. It reflects the efficiency of query management and response processes. A high figure suggests that agents are struggling to resolve certain queries. You can lower this metric by intelligently routing queries to agents who have the right skill set to resolve them.
Repeat Call Rate
This contact center metric tracks the percentage of repeat calls received by a business. Repeat calls occur when the issue isn’t resolved on the first attempt. As a result, a high rate is indicative of sub-optimal first contact resolution.
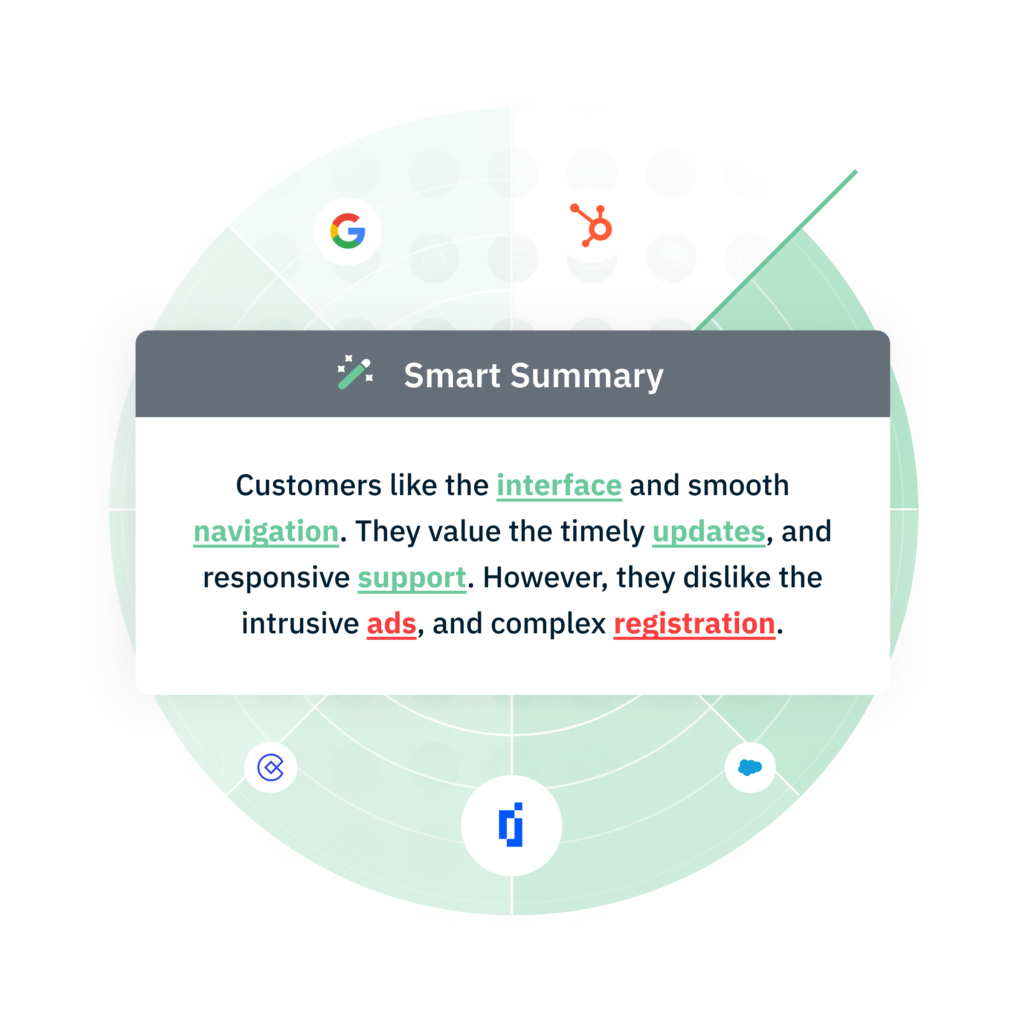
Identifying and analyzing recurring issues can help enable effective resolution. Pearl-Plaza’s contact center AI can help by providing insight into repeat call customer profiles. It leverages analytics and intent recognition to highlight common issues and the information sought by these customers.
Percentage of Calls Blocked
This KPI tracks the proportion of calls that fail to connect because the call center’s capacity is full. High rates indicate that customers are unable to reach support, which can dent their perception of your business. Invest in a good IVR system to handle customers if they can’t reach your agents.
Customer Experience Metrics
Call center metrics are essential to a holistic CX strategy. They serve as vital indicators for your customer experience KPIs, enabling you to track and enhance success across touchpoints.
First Call Resolution (FCR)
This metric evaluates the percentage of calls an agent resolves during the initial interaction without any follow-ups. These follow-up actions could include transferring, escalating, or returning the call later. High FCR indicates effective problem-solving during the first attempt, as it reduces repeat calls for customers.
By training your agents to handle tickets effectively, you can improve your FCR score. The training could include educational resources and role-playing exercises. Leveraging self-service channels can also help address customer concerns without multiple calls.
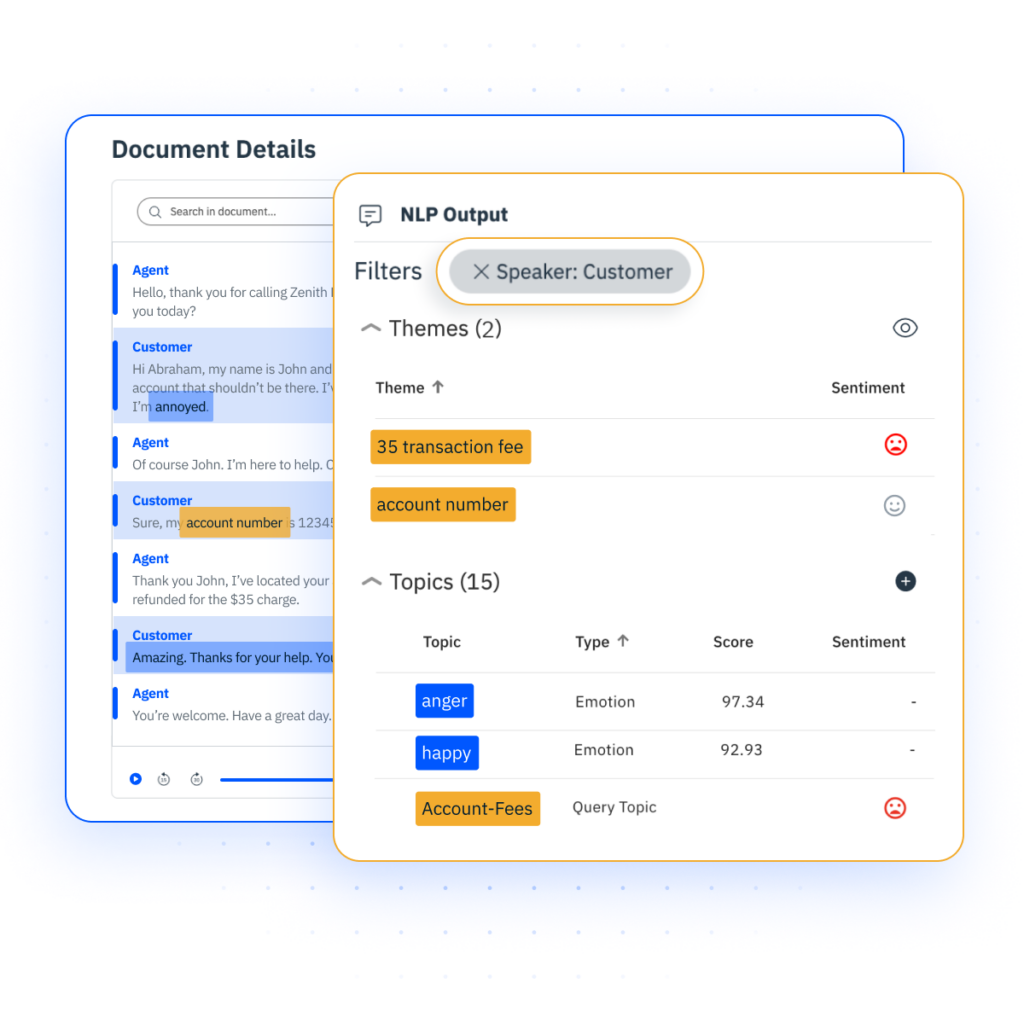
Pearl-Plaza’s conversational analytics software also helps improve your FCR score by allowing you to efficiently analyze speaker data for insights and opportunities to better understand your customers and improve your customer service.
Customer Satisfaction Score (CSAT)
Businesses calculate this metric with the help of a customer satisfaction survey featuring a set of questions. These questions ask customers to rate how satisfied they are with the support provided by the contact center. Higher scores indicate that customers are largely happy with the service and are likely to call again.
Since the CSAT is a quantitative metric, it provides limited context. A customer may have an 8/10 experience, but you’ll have no idea what they liked or disliked about your agent’s performance. After all, the rating suggests that while the overall experience was good, there is slight room for improvement.
Therefore, a good practice is to include text fields at the end of surveys. This option encourages customers to provide relevant details that will help you make better decisions.
Quality Assurance (QA)
Call centers use quality assurance (QA) to monitor their customer service quality. A QA score is generated based on a scorecard after reviewing call recordings and interactions. The scores are used to determine if agents are offering the efficient services expected from them.
For example, are they hesitant when offering solutions? How do they behave in front of a disgruntled customer? Do they balance the quality of the solution with their speed of service?
You can improve QA scores by emphasizing the importance of quality service to your agents. Consider setting objectives for them and giving them recognition when they meet their targets. This can motivate agents to deliver the best possible experiences to customers.
Net Promoter Score (NPS)
If a customer is loyal to your brand, they have likely had a positive experience with your call center, too. The Net Promoter Score (NPS) metric measures loyalty by asking customers how likely they are to recommend your business to others.
Responses are measured on a scale from 0 to 10, classifying customers as promoters, passives, or detractors. Your goal is to understand what experiences contribute to each category. For example, if you find that detractors are disappointed by long wait times, you can potentially convert them into promoters by making your workflows more efficient.
Customer Effort Score (CES)
The Customer Effort Score (CES) for call centers highlights how difficult it is for customers to resolve their issues with your agents. It is usually calculated on a 5- or 7-point scale. Higher scores indicate that customers agree that it was easy to interact with the call center.
You can improve this metric by simplifying the contact center journey. Provide multiple interaction channels, like email and live chat, for contacting agents. Leverage self-service options like chatbots to help customers resolve simpler issues on their own.
Call Center Metrics Examples
Businesses in various industries rely on call center metrics to better serve their customers. Here are two examples from the retail and hospitality sectors that demonstrate the impact of tracking these KPIs.
Retail Call Center
Jane, a customer at a fashion retailer, has a complaint regarding her latest purchase. The boots she ordered online are the wrong size, so she’s hoping to get a replacement. She picks up the phone and is eventually routed to a call center agent.
Despite her negative experience, the business can still make a good impression on Jane by focusing on the following call center metrics:
- Average Speed of Answer: Responding to Jane within 15 seconds will prevent a lengthy wait for her and avoid further frustration.
- Average Handle Time: By following a script and leveraging CRM software to fetch Jane’s details, the agent can quickly understand that she’s looking for a replacement.
- First Call Resolution: Jane isn’t interested in talking to multiple agents. She simply wants to lodge a complaint and get the boots she ordered in the right size. If the agent can process her request and send a replacement by the time the first call ends, Jane is likely to feel better about the brand.
- Repeat Call Rate: It turns out that Jane received the wrong order because of an oversight from the staff. By addressing this specific act of negligence, the retailer can prevent repeat calls related to this issue from Jane and other customers.
Therefore, by tracking a few impactful metrics, the retailer can succeed in resolving Jane’s concern and retaining her as a customer.
Hospitality Call Center
Mark is looking to stay at a hotel for the weekend during his business trip. After a quick Google search, he finds a hotel to his liking. However, he wants to know more about the location and the amenities he can expect. Before picking up the phone, he decides to visit the hotel website.
By including an AI-powered chatbot on its website, the hotel contact center can improve the following metrics:
- Average Time in Queue: Mark asks the chatbot a few questions and receives satisfactory answers. As a result, it’s very likely that he doesn’t need to call the hotel anymore. He doesn’t have to wait in a queue, and things are off to a great start for him!
- Cost Per Call: Since Mark’s query is resolved on the website, he doesn’t have to contact an agent. It saves the business time and labor costs that can be invested into improving its operations.
- Peak-Hour Traffic: By encouraging Mark and other customers to utilize its chatbot, the hotel can prevent calls for basic to moderate queries. As a result, it’s less likely to receive an overwhelming volume of calls, which will help it manage peak-hour traffic.
Therefore, investing in self-service technology helps the hotel’s call center agents by saving them time and effort.
How to Improve Call Center Metrics?
- Invest in agent training and coaching.
- Implement self-service options.
- Automate routine tasks.
- Use QA scores to monitor and improve performance.
- Emphasize First Contact Resolution.
- Track call center progress over time.
- Set goals for your agents based on metrics.
- Create effective call center scripts.
- Collect and act on customer feedback.
- Leverage contact center software.
Tracking call center metrics highlights key strengths and weaknesses. For example, a high cost per call might indicate efficient use of resources and workforce. However, a low call availability could suggest that you need to invest in more agents to avoid overwhelming your current staff.
With this information, you can make adjustments to optimize call center performance. Here are some strategies you can implement to improve call center metrics for customer satisfaction.
1. Invest in Agent Training and Coaching
Agent performance metrics help you identify issues holding your agents back. Maybe they struggle to work under pressure in peak hours. Perhaps they don’t have easy access to customer data.
By training your agents to handle a range of scenarios, you can ensure they are better prepared to meet customer expectations at all times. Consider surveying them and tracking their QA scores to create targeted coaching programs for them.
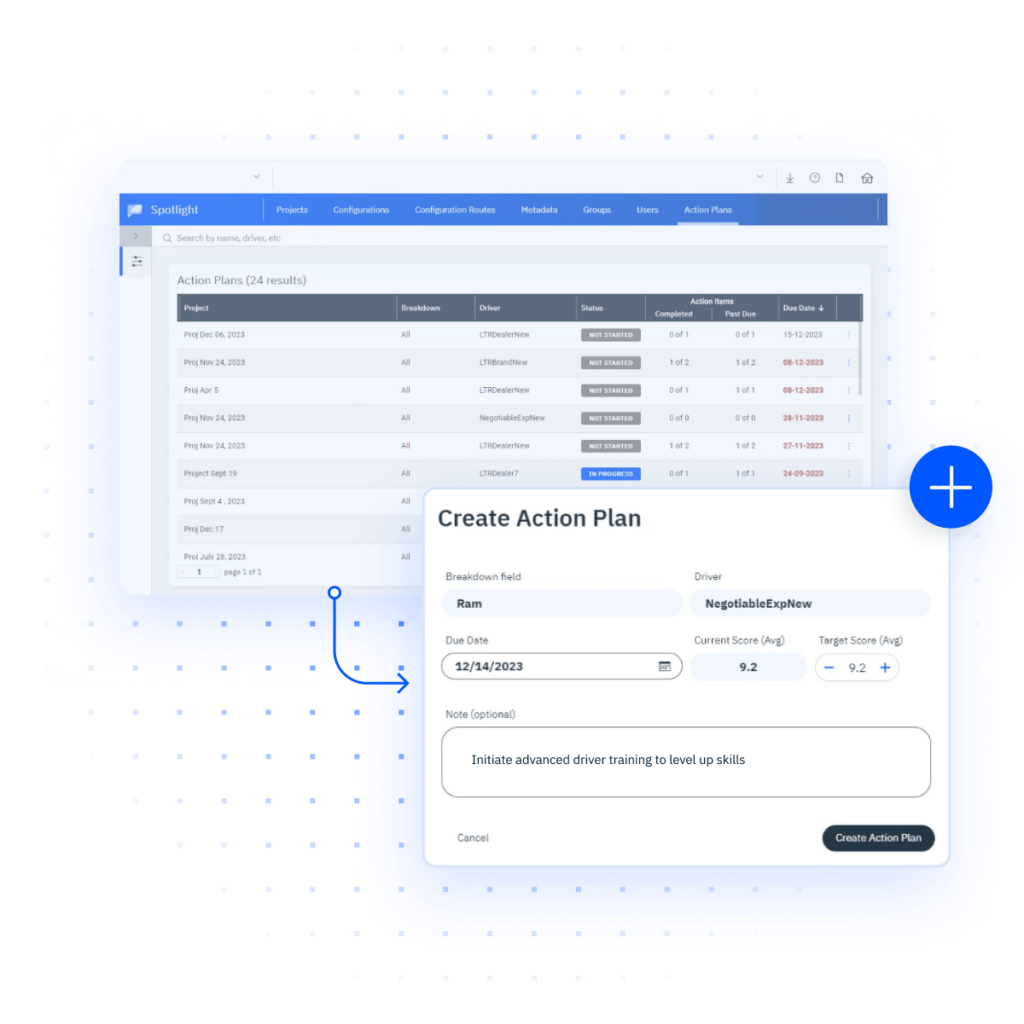
Pearl-Plaza’s contact center solution gives managers the power to create action plans for employees based on smart recommendations from past interactions. With these customized action plans, managers can effectively improve employees’ performance.
2. Implement Self-Service Options
Self-service options like chatbots, IVRs, and online FAQs encourage customers to find quick answers. As a result, customers with basic queries don’t have to wait in queues or be put on hold. It also frees up time and effort for human agents that they can put towards resolving complex issues.
3. Automate Routine Tasks
A great way to make the most of your agents’ time is to automate repetitive tasks. For example, processes like data entry and follow-up emails don’t require human intervention. Automating these tasks can save agents time that they can put toward more impactful customer experience tasks.
4. Use QA Scores to Monitor and Improve Performance
QA scores evaluate agents’ interactions to ensure high standards. Regularly monitoring these scores highlights areas for coaching and skill improvement. This helps agents deliver consistently high-quality service.
5. Emphasize First Contact Resolution
Emphasize the importance of effective issue resolution to your agents. Solving problems within the first attempt reduces the repeat call rate and customer frustration. Training and equipping agents with CRM software can help enhance first contact resolution.
6. Create Effective Call Center Scripts
A good call center script provides a template that agents can refer to for quick issue resolution. It also helps prevent inaccurate responses to customer inquiries. However, a script alone isn’t enough. Your agents need to understand the value of improvisation to address customer needs.
Train your staff with role-playing scenarios so that they can practice how to use their scripts in various scenarios. Encourage them to come up with quick solutions in situations where scripts don’t provide the relevant information.
7. Track Call Center Progress Over Time
Monitoring call center metrics over time helps identify trends and areas that need attention. Consistent tracking enables data-driven decisions. It also allows managers to adjust strategies to meet performance goals effectively.
8. Set Goals Based on Metrics
Setting metric-based goals gives your agents something to work towards. For example, you can set a goal of answering calls, on average, in less than 20 seconds. Giving your agents recognition for achieving these goals will motivate them to be even more productive in the future.
9. Collect and Act on Customer Feedback
A customer-centric brand understands the value of feedback for all aspects of its business. Ask customers to rate their experience after each call with a single digit. Collect more in-depth data through a customer feedback questionnaire every month. Acting on this feedback shows your commitment to customer experience. It also highlights the necessary changes you need to make to improve call center performance.
10. Leverage Contact Center Software
Contact center software helps streamline data tracking, call routing, and analytics. For example, Pearl-Plaza’s tools offer insights into performance metrics, which enables informed decisions for process improvements. These tools support consistent, efficient service so that your agents can deliver positive experiences.
How to Report Call Center Metrics and KPIs
The right call center technology can help you track and report key metrics. Reporting is crucial as it transforms raw figures into actionable reports for call center management. It provides insight into call center performance and what aspects require improvement.
Using a Call Center Metric Dashboard
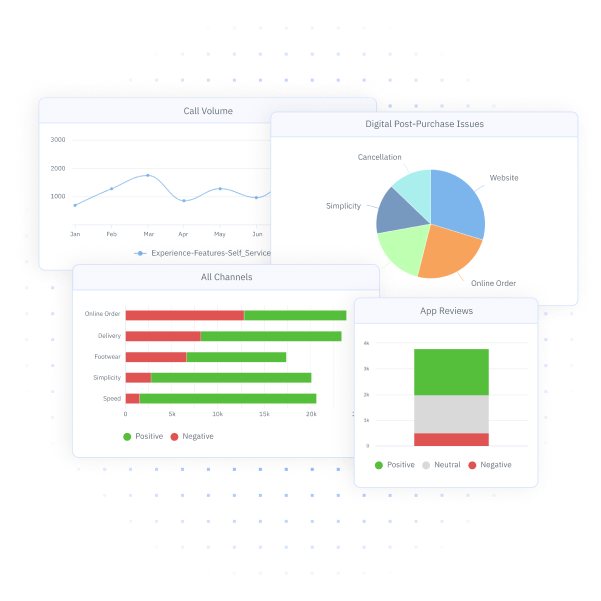
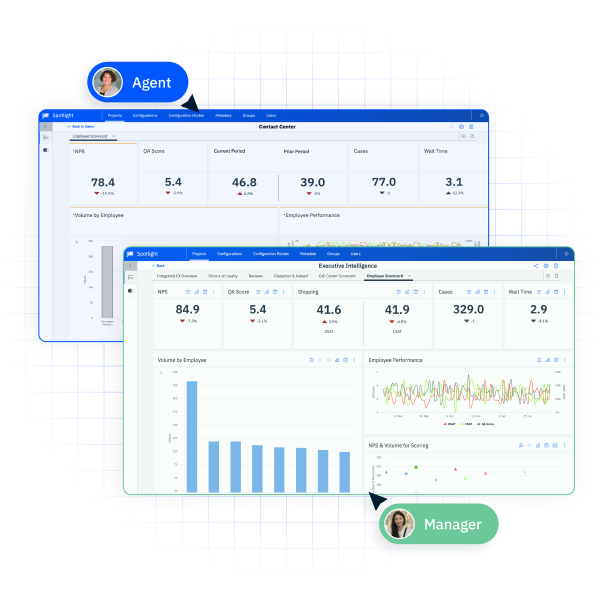
Dashboards are powerful tools for reporting and visualizing call center metrics. They can help you improve performance by providing real-time visibility into KPIs and operational data.
Agents can leverage dashboards to track important metrics like call volume, average talk time, and satisfaction scores. This transparency helps them identify wins and areas for improvement in their performance. As a result, they have the information and motivation to meet their targets.
Call center managers can leverage dashboards to monitor their department’s performance. For example, they get a comprehensive view of metrics like adherence to schedule and service level rate. This enables them to make data-driven decisions, allocate resources effectively, and identify which agents to train.
Enhancing Call Center Analytics with Pearl-Plaza
A call center can be a valuable asset to your business. By providing instant and efficient support to customers, your agents can help encourage customer loyalty. With the help of Pearl-Plaza’s contact center software, you can report key metrics and gain analytical insight into both customer and agent experiences. See what Pearl-Plaza’s platform can do for you by taking a product tour today!
References
Invoca. 39 Call Centre Statistics You Need to Know in 2024 (https://www.invoca.com/uk/blog/statistics-call-center-managers). Accessed 30/10/2024.
Pearl-Plaza. Pearl-Plaza Market Pulse (https://www.linkedin.com/posts/weareinmoment_b2b-customersuccess-ai-activity-7251989745914818560-haGe?utm_source=share&utm_medium=member_desktop). Accessed 10/30/2024.


