General Archives – Page 12 of 12 – Pearl-Plaza

The real value of customer experience programs is not in gathering customer feedback, but in putting the voice of the customer to work. While there was never a positive return on investment (ROI) for simply measuring satisfaction (no more than there is a positive ROI for taking your temperature when you are sick), today’s cost/benefit driven environment has made the need for meaningful action even more acute.

At a Glance

Most organizations invest in measuring customer experience and satisfaction with an expectation that the insights derived will lead to product and service improvements and better customer experiences. Unfortunately, far too many organizations simply hand customer feedback to managers with instructions to “use the results to take action.” The consequences? Quite often, no action is taken and the anticipated improvements in customer experience fail to materialize.

Start to Utilize Your Feedback

A growing body of evidence reveals that a majority of organizations are not where they want to be when it comes to putting the voice of the customer to work. These five steps will help you guide you to identify people and actions to be taken so that the feedback you are receiving can be utilized.

Step 1. Identify High Priority Customer-Driven Action Items

Quite often, analysis of customer survey items – each of which represents a specific element of the customer experience – is the starting point for defining action items. Specifically, items identified as “key drivers” of overall customer satisfaction and loyalty, and those that receive relatively unfavorable customer ratings are designated as customer-driven priorities for improvement. Many organizations also look at additional Voice of Customer (VoC) data sources (e.g., inbound customer comments and complaints, user-generated media, etc.) to corroborate initial conclusions based on analysis of survey data. Overall, the analysis of customer feedback enables the organization to define customer-driven action items.

Step 2. Determine Owners of the Customer-Driven Action Items

The next step in the process involves a review of customer feedback by a cross-functional team of managers. These managers collectively determine the people and parts of the organization that impact and have some level of ownership of each action item. It is the “owners” that must take the lead in developing and implementing an appropriate action plan.

Step 3. “Drill Down” for Clarity and Granularity

The analysis of survey items often provides the starting point for customer-driven action planning and implementation. However, the survey instruments are not generally designed to provide enough detail or granularity to enable an organization to determine the specific action to take. As a result, the action-item owners are limited by an incomplete understanding of “what to do.” This leads to one of two unfortunate outcomes:

  • The actions taken to respond to the voice of the customer are misguided and ineffective
  • Managers and employees end up taking no action at all because they lack clarity regarding what the customer wants or needs

In contrast, organizations that are successful in applying customer feedback to drive improvement ask themselves a simple question before developing and implementing action plans: Do we understand what the customer wants us to do or do differently?

The third step in the process requires that owners of a customer-driven action item confirm that they have sufficient understanding of what customers actually want the company to do or do differently. Social media can provide insight into what customers want or expect and knowledge from social media sources can be valuable. If not, the group must determine the questions to address and areas requiring “drill-down” for clarity and granularity.

Step 4. Pinpoint Policies, Processes, and Operations Associated with High-Priority Action Items

Once a customer issue is clarified and ownership for action established, a fourth critical step in the process is to identify and target the relevant business enablers. What are the organizational processes, policies, practices and other aspects of performance that are connected to the targeted element of the customer experience? The owners must answer this question to ensure that they identify and x the “right things.”

Step 5. Develop and Implement Appropriate Action Plans

Upon completion of these first four process steps, the organization has put itself in a very good position to develop and implement an appropriate customer experience improvement plan, because:

  • The people and parts of the organization that impact the customer-driven action item have been identified
  • These owners understand what customers want the organization to do
  • The owners have pinpointed the organizational processes, practices, policies and other performances issues that need to be changed and improved

Essentially, the “guess work” has been taken out of developing and implementing an appropriate customer driven action plan. Now, it’s time for the owners to develop the plan.

Well-conceived action plans require solid information about what to change and how to change it. Integrating action
items identified through the customer feedback process with operational training tools to guide action is a best practice to drive improvement. For many organizations, integrating these elements within the reporting platform is the most effective way to arm corporate and front-line managers with the tools they need to address improvement areas.

Connect to the Right People

Companies investing in capturing, crunching, and sharing insights derived from customer feedback will make some progress toward putting the voice of the customer to work. However, unless these organizations implement a process to connect customer feedback to the right people, and the right business processes, policies and activities, progress likely will be stalled.

Editor’s note: This article originally appeared on the CX Cafe Blog.

Automotive Dealership Loyalty Study Background

Purpose of the Study: To determine the relationship between dealership satisfaction, dealership customer loyalty and dealership revenues.

This was a follow-up study of 2009 and 2010 model year vehicle purchasers who returned MaritzCX’s New Vehicle Customer Study. Customers were asked about their vehicle service behaviors and vehicle repurchase behaviors since purchasing their 2009 or 2010 vehicles.

Two Data Sets

  • All Respondents (n=12,875)
    • Weighted to 2009 and 2010 vehicle sales by model
    • Used for Sales to Service Loyalty analyses and service usage analyses
  • Vehicle Replacers (n=5228)
    • 5431 had replaced their 2009 or 2010 vehicle
    • 203 respondents removed because their original brand was no longer available
    • Weighted to 2009 and 2010 vehicle sales by model
    • Used for Sales to Sales Loyalty and Service to Sales Loyalty analyses

Key Dealership Measures

Dealership Sales Satisfaction – Satisfaction with the dealership purchase experience as reported by customers in 2009 or 2010.

Overall Dealership Satisfaction – Satisfaction with the selling dealer over the lifetime of the vehicle as reported by customers in 2016.

Dealership Sales-to-Sales Loyalty – The percentage of vehicle replacers who purchased their replacement vehicle from the same dealership that sold them their 2009 or 2010 vehicle.

Dealership Sales-to-Service Loyalty – The percentage of customers who reported that they usually used their selling dealership for various types of service work.

Service-to-Sales Loyalty – The percentage of vehicle replacers who purchased their replacement vehicle from the dealership that sold them their 2009 or 2010 vehicle by where they usually had their 2009 or 2010 vehicle serviced.

Sales-to-Sales Loyalty

Dealership Satisfaction and Dealership Loyalty

Both dealership sales satisfaction and overall dealership satisfaction are strongly related to dealership sales loyalty

  • Customers completely satisfied with the dealership are over four times more likely to buy from that dealership again compared to very dissatisfied customers

Dealership Loyalty and Brand Loyalty

While dealership satisfaction is more associated with dealership loyalty than vehicle brand loyalty, both show strong relationships

  • Those completely satisfied with their dealerships are about twice as likely to re-purchase the brand as those that are very dissatisfied with the dealership

Sales-to-Service Loyalty

Dealership Sales Satisfaction and Service Loyalty

Customers with higher levels of dealership sales satisfaction are about 50% more likely to have their vehicles serviced at the dealership:

Overall Dealership Satisfaction and Service Loyalty

That relationship gets stronger when looking at overall dealership satisfaction

  • Customers are two to three times more likely to service at the dealership if they rate their overall dealership experience completely satisfied vs. very dissatisfied

Dealership Satisfaction and Service Spend

As customers are less satisfied with their dealerships, service spend doubles at independent facilities and halves at the selling dealerships

Service-to-Sales Loyalty

Service Usage by Service Type

About half of customers report usually using their selling dealership for all types of service work, but this tapers off for out of warranty service

  • Independent facilities are picking up this work

Service Provider and Dealership Sales to Sales Loyalty

  • Dealership sales to sales loyalty is over 50% if their customers usually have their vehicle serviced at the dealership
  • Dealerships really want to avoid customers servicing at other dealerships. Only about 10% of customers who service their vehicles at other dealerships return to the selling dealership when replacing their vehicle.

Show Me the Money – A Financial Model

Financial Impact of Dealership Satisfaction on Dealership Revenue

For the average US dealer

  • Increasing satisfaction of all customers by one “box” on a 5-point scale generates approximately $2.5 million in loyalty related revenue
  • Allowing satisfaction to fall one box for all customers equates to a loss of $4.2 million in loyalty related revenue

On a typical 100 point scale, each point of customer satisfaction relates to approximately $151,800 in additional loyalty related sales revenue for each dealership

Model Showing the Financial Effect of Increasing Satisfaction One Level

Model Showing the Financial Effect of Decreasing Satisfaction One Level

Scaling to 100-Point Scale

To model loyalty changes on a typical 100-point satisfaction scale, we converted the 5-point scale by assigning the values of 100, 75, 50, 25, and 0 to the boxes from Completely Satisfied to Very Dissatisfied. We then extrapolated the models shown previously to the points where all customers where completely satisfied and all customers were completely dissatisfied.

For all the models in this process we calculated the 100-point satisfaction score and the associated loyalty rate. These points were plotted on the graph below. Because the resulting curve is mostly linear, a trend line was fit to it, and its regression equation was determined. This equation and its associated line shows that every point on the 100-point scale relates to a .45 percentage point change in dealership sales-to-sales loyalty

  • For the average dealership with 1003 vehicle sales, that equates to a change of sales revenue of $151,830 per point1

1Assumes an average selling price of $33639 per vehicle as reported by the National Automobile Dealers Association for 2014 (the most recent data available).

Don’t Know Option in Surveys

Editor’s Note: This blog was originally posted on CX Cafe’.

Your respondents might know more than you think.

Including a “don’t know” option in a survey is an issue that is currently under speculation.  The “don’t know” option can be explicit, as shown with the scale, or it can be implicit by the use of skip patterns within a survey.  It’s a powerful option to give survey takers who don’t really know the answer–an option so they don’t get frustrated, but it also can serve as a cop-out for those who just don’t want to answer the question. So where do you draw the line?

The “don’t know” option can contribute to good survey design, because it utilizes skip patterns to alleviate the need of showing respondents a set of questions that are not applicable. However, if the “don’t know” option is associated with attitudes concerning relevant touch points or facts, you may want to reconsider including that option in your surveys.

So what happens if you include the “don’t know” option in your Survey?

  • First, when that option is present, respondents are more likely to select it than engaging in the question.
  • Second, researchers have found that respondents do a pretty good job at answering questions in the face of uncertainty.  For example, if a fact-based question had four choices, respondents who initially said don’t know had much higher accuracy than the 25% that guessed at random.
  • Third, attitudes can be more reliably “guesstimated” than facts.
  • Fourth, if respondents choose “don’t know,” multivariate analysis requires those answers to be treated as missing, so the data is not inaccurate.  For missing values, we often use methods to try to recover those answers (imputation). Who do you want to estimate those underlying values? The researcher? The respondent?
  • Fifth, and finally, placing a “don’t know” option on a crowded scale or not setting it apart from equidistant scale points can lead to respondent confusion and incorrect selections.

The fear of not using “don’t know” is that you are forcing the respondent to provide meaningless responses. However, the use of “don’t know” can lead to MORE data problems.  In general, minimize the use of “don’t knows” in your surveys, for a more powerful and informative survey.

Note: There are some considerations about omitting the “don’t know” option on mandatory questions.  If there are too many questions which force the respondent to answer, the respondent could get more frustrated without the “don’t know” option. Depending upon the questions you are asking on your survey, it is key to find a healthy balance between adding “don’t know” on your survey and taking it off.

How to Get High Response Rates to User Surveys on Mobile

In this age of survey fatigue, getting users to engage with a survey in any medium is challenging. Mobile apps are no exception, and have their own unique constraints. The good news is that in-app surveys can provide a streamlined mobile experience that results in super-high response rates and meaningful feedback, too.

In this age of survey fatigue, getting users to engage with a survey in any medium is challenging. Mobile apps are no exception, and have their own unique constraints. The good news is that in-app surveys can provide a streamlined mobile experience that results in super-high response rates and meaningful feedback, too.

Asking for survey response on a mobile screen can create a friction-y experience for users.

Low screen attention. Small, cramped mobile screen. Tiny text. Question after question. Who wants to deal with that?

You need a streamlined survey solution that reduces friction but still provides rich feedback.  So, how do you overcome the constraints of mobile?

Mobile App Surveys

Net Promoter Score surveys minimize friction.

Net Promoter Score (NPS) is recognized as a powerful measure of customer happiness, and a lean, agile way to elicit meaningful feedback from users. Not familiar with NPS? Here are the basics.

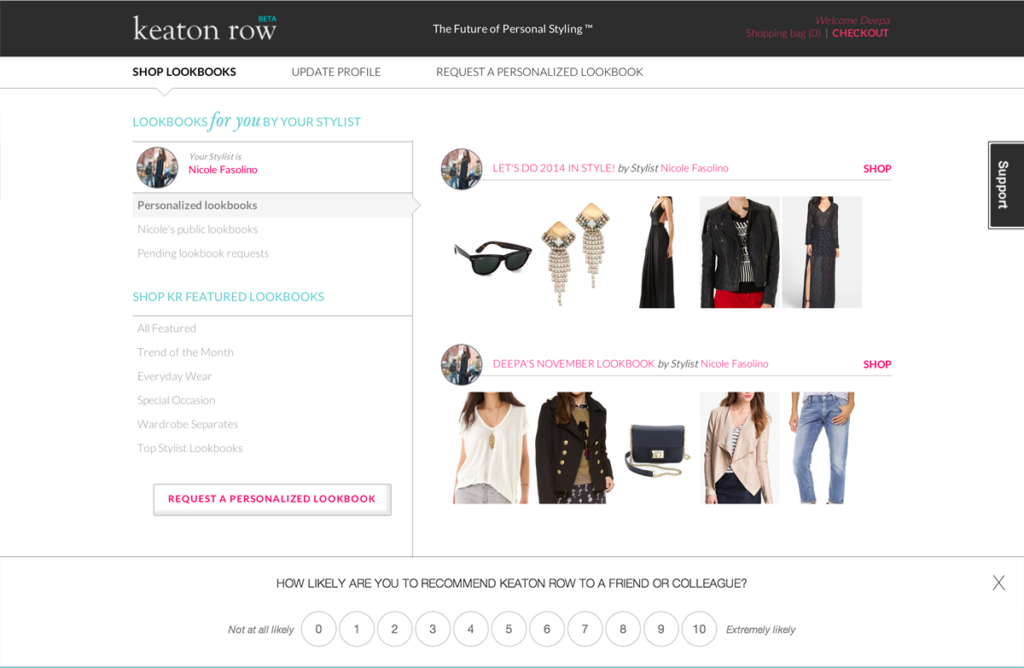
The NPS survey consists of a single survey question, plus an opportunity for a quick qualitative response. Because of its simplicity, the NPS survey really shines in the mobile context.   Have a look at how it works here on Android and iOS.

Surveying mobile users via email can mean low response rates.

Until now, mobile businesses have had to rely on email surveys to get NPS user feedback, and email certainly has its place. Trouble is, app developers may not have a user’s email. Even when you do, inboxes are noisy places and readers are less likely to click through from mobile devices. Also, an NPS survey via email arrives after the fact, after your user has left your app. Their attention is elsewhere.

For high response rates, ask the powerful NPS question right in your mobile app.

You can now show your user an NPS survey in real-time, when he or she is engaged with your app on a mobile device.  Users are scoring and commenting in context – feedback is fresh and relevant, which helps make it more actionable. Typically, you will see a 40-60% response rate right off the bat.

Surveys can be triggered to suit your business needs. For example, a user could see a survey after she has logged in x number of times, taken a specific action, or 30 days after downloading the app.

Using an external platform to manage your NPS process has its advantages. It can scale easily, is hassle free to try and deploy, and frees up resources to focus on the “so what?”  — leveraging NPS results to improve your application. A streamlined version of an NPS platform can come free and shouldn’t break your budget.  Our tool, Wootric, is one example.

Get the ebook, The Modern Guide to Winning Customers with Net Promoter Score. Learn eight ways to leverage Net Promoter Score for customer loyalty and growth.

To maintain strong response rates, take action on user feedback.

Maybe you filled out a survey once — really took the time to give constructive feedback. Did you hear back from the company?  If you did not, how likely are you to fill out another survey from that company? Not very likely, right?

For you to continue to garner high survey response rates, your mobile users must know that their feedback matters.  An NPS platform dashboard makes it easy for you to respond. The dashboard is where you can monitor the cumulative Net Promoter Score your app is earning, and slice and dice your data. It is also where you can see individual scores and qualitative feedback from individuals.

If your users have accounts and you have the resources, you should respond directly to individuals. You can do so right from your NPS dashboard.  You can also forward feedback to a team member in Customer Support, Customer Success, or Product Management for further action. To streamline the process, you might automate an email response to the bulk of respondents depending on whether they are Promoters, Passives or Detractors.

If your users are anonymous, at a minimum, you can acknowledge in software release notes that it was user feedback that revealed that recently-squashed bug, or drove the development of xyz feature.

High response rates and rich user feedback are possible in the mobile environment.

The streamlined nature of the NPS survey is a great fit for the low-attention span of the mobile user and the constraints of the small screen.  Consider in-app NPS surveys for higher response rates than email.  Be sure to show your users that you listen to their feedback, they will be more likely to answer another survey down the line.

Start measuring Net Promoter Score in your mobile app for free with Pearl-Plaza

Net Promoter Score Implementation: DIY or Outsource?

The beauty of Net Promoter Score is its simplicity. At the core, it is one key numeric ranking question supported by an open ended “why” question. (See my post on the ABCs of NPS to learn the basics.) It’s a question that can be asked in many channels: over the phone, in an email, in your website or mobile app, in person. A variety of tools exist to help you execute NPS for your business with various degrees of complexity and cost. These range from setting up your own email survey to using an automated service to hiring a consulting firm to implement NPS programs for your company. Here’s a snapshot of what these different options have to offer:

The beauty of Net Promoter Score is its simplicity.  At the core, it is one key numeric ranking question supported by an open ended “why” question.  (See my post on the ABCs of NPS to learn the basics.) It’s a question that can be asked in many channels:  over the phone, in an email, in your website or mobile app, in person.  A variety of tools exist to help you execute NPS for your business with various degrees of complexity and cost.   These range from setting up your own email survey to using an automated service to hiring a consulting firm to implement NPS programs for your company.  Here’s a snapshot of what these different options have to offer:

Read More…

6 Customer Engagement Tips from The Experts

Whether you specialize in customer experience, engagement, success, or service, you're tasked with retaining and delighting customers all the time. Plus, you have to get to know them.

Whether you specialize in customer experience, engagement, success, or service, you’re tasked with retaining and delighting customers all the time. Plus, you have to get to know them.

It’s tough!

That’s why we talked to 6 customer engagement experts to find out what strategies bring the most success. Here are their top tips:

1. Using Tools as You Scale

At Grasshopper, we struggled with finding ways to engage our customers as we grew. It became a real challenge for us to develop and maintain strong connections with our customers the way we used to: sending welcome packages, notes and swag to people we spotted on social doing cool things or giving us shout outs.

We realized that what we were doing was becoming harder and harder to scale, Read More…

When I was growing up, a 50-cent, bottomless cup of coffee was the norm. People would have laughed at the thought of a five-dollar cup of joe, and yet how many of us drive out of our way to find a Starbucks to start our day? In the case of Starbucks, it is not even about the quality of their coffee. You can go to the grocery store and purchase the same coffee there, yet people flock to Starbucks stores because they provide an experience and not just a cup of coffee.

Today, the coffee shop is an iconic gathering place. From the moment you walk in, the aroma of the coffee surrounds you. The environment in the store is calm, relaxing and inviting. The store invites you to stay and relax for long periods, and many people stay to study, work, check their e-mail, update their social media account, surf the web, or share some time with friends. The servers are not called servers; they are “baristas,” adding to the sense that you are doing more than just grabbing an ordinary cup of coffee. Each cup is prepared individually and the customer’s name is written on the cup to personalize the experience.

In other words, the product is not the focal point; rather, the focal point is the experience that the company delivers.

Successfully delivering a good customer experience requires a comprehensive orchestration of a great many things. One of the most essential to the backbone of your CX program is a thorough understanding of the customer and his or her experience with your brand, people, product and service — a process popularly known as customer journey mapping.

Starbucks knows its customers well. It has a well-mapped journey of what the experience will be like from the moment the customer walks into the store. By selling more than just a product, the company is able to charge 5-10 times what a competitor could and still attract more customers. Starbucks clearly understands that focusing on the customer experience is not just a corporate tagline for shareholders. It is a business strategy.

What Is a Customer Journey Map?

A customer journey map is a visual representation of the journey a customer has with your brand, products, services and people. It is important to note that journey mapping is not an appropriate replacement for quantitative efforts, but rather a good starting point or supplement to quantitative programs. It includes multiple touchpoints from the customer’s point of view, such as:

  • Key moments and evaluation points in the process
  • Positive and negative components of the experience
  • Attitudes and emotions that may come into play

Step One: Build the Company View of the Journey

Mapping the customer’s journey starts with identifying and building out the steps of the journey from the company’s point of view, from beginning to end. Start by identifying the key moments a customer has with the company. Getting agreement on the discrete steps a customer takes can be difficult, as each functional area and stakeholder will bring a unique perspective to the table. It is critical for the organization to work off a common vision of the journey, so measurements, improvements, and enhancements must be created using a shared framework.

Building out the steps

Once the steps of the journey are identified, build out the experience of each step, including the following elements:

  • Customer’s desired outcomes
  • Time or duration
  • Attitudes and thoughts
  • Emotional responses
  • Emotional needs
  • Customer pain points
  • Areas of weakness
  • Areas of strength
  • Importance of the step
  • Satisfaction with the step

Though some might argue that this process is overkill for organizational stakeholders to go through, the elements of this process enable a more educated approach to the secondary probing and qualitative research phase. Additionally, the process of including all stakeholders embeds customer journey mapping within the cultural framework of the organization. As stakeholders help build the journey, hear different perspectives from their peers, and eventually see the customer’s perspective of the journey, they are more likely to understand and accept the final product. Finally, it is very insight-provoking at the end of the process to highlight the differences in what the customer sees as critical moments and evaluation points in the journey compared to company stakeholders.

Customer-Centric Blueprint

A by-product of customer journey mapping is a customer-centric blueprint, which highlights customer experiences that lead to a decision or behavior that impacts financial outcomes for the organization. A customer-centric blueprinting process involves:

  • Determining what critical elements are impacting each step in the journey
  • Identifying all people and departments who are even remotely connected to this element
  • Identifying the policies, processes, procedures and tools that impact this element
  • Listing all internal metrics associated with this element of the step, which can serve as early indicators of a good or bad experience by the customer before they even take a survey

Step Two: Build the Customer View of the Journey

Once the internal stakeholders have created their view of the customer journey, it is time to have the end customer validate this framework. A series of qualitative research sessions are usually helpful for this purpose. In these sessions, customers walk through their version of what the journey looks like, using all the same criteria used by internal stakeholders.

During or prior to the interview, customers may also be asked to:

  • Create a collage, drawings or photos that illustrate how they feel about the experience they have when dealing with the brand, category, product, service or people. (See an illustration below of one perspective on air travel.) The use of imagery adds a richer perspective to the experience, which can elicit deeper insights than verbal cues alone.
  • Share metaphors that describe what their emotional needs are at each step. These can come from a standard list, or they can share their own. This part of the process creates a clear delivery goal for the company at each step of the journey.

Step Three: Review the Current State

The next phase of the journey-mapping process often takes the form of a workshop, during which the customer journey is reviewed, while keeping the following objectives in mind:

  • Create a common understanding of the customer journey
  • Identify areas within the experience with the greatest opportunity to improve/address
  • Identify elements that should be included in the VoC program
  • Review the design criteria for improvements and development of new experiences
  • Prioritize the steps in the journey that should be addressed

This step is critical for embedding the journey into the organization. It involves immersing participants in the qualitative research in a way that helps them step into the shoes of their customer. In order to do this, the room where this final workshop is conducted is turned into a customer gallery, which may contain detailed summaries of each step in the journey, customer quotes from the qualitative research, any photos or imagery created or solicited during the research, and any relevant previous research that contributes to the organization’s understanding of the customer journey.

Once this information is absorbed, it is time to prioritize the areas the company considers more important to focus on for improvement. Among the improvement opportunities is the chance to evaluate the current VoC measures against what customers identified as their key moments of the experience. This process can either validate the current measures or identify gaps that need to be filled with VoC tools.

Step Four: Create Customer Experience Design Criteria

You now have detailed journey maps, photos, interview transcripts, previous research, customer quotes, etc. How do you make sense of this and avoid everyone running in a different direction to improve the customer experience?

Creating common customer experience design criteria helps prevent organizations from becoming overwhelmed. Customer experience design criteria are the three or four top criteria that serve as the essence of what customers need in any experience they have with your organization. These criteria are derived from analyzing the attitudes, thoughts, emotions, and needs of customers at each step in the journey, and then identifying a few common themes that represent the essence of what the customer needs. For example, the design criteria for a business technology supplier may look like the following:

  • Proactively identify solutions that add success to the business owner
  • Be impressively responsive
  • Remove the technology burden from the business owner
  • Make every interaction professional

Each of these represents what the business owners conveyed throughout the journey. By creating common design criteria, everyone in the organization can now use these as criteria that should be met in any customer-impacting service, tool or interaction. Additionally, marketing and customer-facing communications should also reinforce the same criteria so that there is better alignment with every customer touchpoint.

Step Five: Ideate a Future State

The final phase in the customer journey mapping process is to leverage the new insights and design a better customer experience. One of the greatest challenges in any customer experience program is achieving true organizational commitment and buy-in. It is not that companies are against having a customer focus; quite the contrary. The challenge is getting the attention of stakeholders who are stretched so thin that it is difficult to get their attention. But the benefits of engaging stakeholders in customer journey mapping gives them a vested interest in the process and increases their common knowledge of the customer experience well beyond where it was.

The final step is to leverage this insight and engagement into the design of a better customer experience. This is done through ideation. Unlike brainstorming, ideation is structured so that it can take participants beyond their current framework of thinking and view solutions through different lenses using the customer experience design criteria previously identified. While ideation is intended to unleash creative thinking, the design criteria help ensure the thinking is focused on what the customer needs the new solutions to address.

While there are entire books written on ideation alone, here are a few of approaches with very brief descriptions:

TOP MIND IDEAS: People throw out top of mind ideas (these tend to be very incremental/not very innovative, but allow people to get the pent up demand ideas out of them).

PICK YOUR PROBLEM: Split up into groups — each group picks two to three high priority problems/opportunities identified in the journey mapping. Each group then develops as many ideas as they can around their selected items.

RELATED WORLDS: After breaking into smaller groups, each group picks an industry outside of the one where they operate. Each group then identifies the characteristics of the selected industry, focusing on how that industry generally solves its key problems (e.g., cell phone companies require contracts for additional service, they offer the phone for free or at a steep discount based on a two year contract, etc.). The intent is then to leverage the list of characteristics to ideate around how companies in the related industry would apply their thinking to solve the problems at hand in your business.

Get Fired/Get Hired High Risk — High Reward Ideas/Far Out Ideas.

GET FIRED: Moderator encourages participants to generate ideas that are so outrageous that in a normal meeting you would “get fired” for bringing them up.

GET HIRED: Moderator asks the group for ideas that scale the outrageous ideas back to something for which you would “get hired.” The intent is to give participants the license to bring up ideas that normally they may be too cautious or prudent to do.

Idea Tournament Session

The last step in the ideation process is to take the mountain of concepts and evaluate them in order to whittle them down to something more manageable. A structured process of voting is used based on top-of-mind reactions and tied to the design criteria. Different targets can be set, but generally allow people to vote for 10% of the ideas. Once this is complete, a process of evaluating the ideas on criteria such as customer need, revenue potential, feasibility, ability to create a sustainable competitive advantage and time to implement (or other gauges that are relevant to the organization) is completed. The output is a “portfolio” of ideas that includes some ideas with “breakthrough” potential (high risk — high return), and others that are more incremental in nature (low risk — low return).

Conclusion

The end result of conducting a thorough customer journey mapping process is a more comprehensive understanding of the experience your customer has with your organization, insights in the areas that need to be addressed, ideas on how to improve the experience, and a common understanding of the experience your customers have with your organization. Walking out of this process, you will also have the following outputs to continue to guide the organization’s journey to improve the customer experience:

  • Journey Map: Company view of the customer journey
  • Journey Map: Customer view of the journey (both a detailed version and a more aggregate version that can be shared more broadly across the organization)
  • A customer-centric blueprint
  • A common set of customer experience design criteria
  • A portfolio of new ideas to improve the customer experience (both short term tactical ideas and longer term break-through ideas)
  • Transcripts of interviews
  • Visuals created by customers
  • A list of measures to consider adding to new or existing VoC efforts
Let me make a suggestion right out of the gate. While many customer experience practitioners have readily adopted customer journey mapping as a best practice, too many of us look at it as a “once-and-done” activity. We mistakenly see the effort to understand and document the customer journey as almost a checklist step in a project plan with little if any utility value other than the production of a graphical “map” to hang on the office wall and to inform our design process only at the onset of new initiative.

Instead, may I offer the suggestion that we need to consider the customer journey as an evolving, living thing that will change over time as customers find new preferences and manners of interaction and experiences with us. As such, I’d like to offer up the idea that we look at the journey with fairly frequent revisits and, in doing so, work to manage the evolution of the journey. This will keep us from seeing the effort to understand it as a static step we often consider only at the beginning of a new customer experience improvement process.

We accept the notion that our customers are not sitting still and limiting their interactions with us to the same ways and for the same reasons they always have. They do not have a permanent “business as usual” approach to literally everything. Why then could it be sufficient to seek to understand the customer journey as only a single point-in-time exercise? Instead, why can’t we consider revisiting the process a few times a year as our markets and customers mature and evolve?

The purpose of follow-up journey assessments is to re-focus on gaps created by market conditions and changes in customer preference. These updates will bring value as we prioritize our own transformational efforts, focus on areas where we can implement customer-centric innovation and process improvements, and develop and launch new solution offerings. They will enable us to align our new developments with the refreshed journey map and moments of truth along it.

We can (in a progressive mindset) consider customers and their journeys with us as assets, no different from cash in the bank or infrastructure. Then why not do a new journey assessment and artifact map even quarterly, just as we produce financial statements several times a year? It’s just another way to look at this unique asset class; our customer relationships.

Even if you’re thinking to yourselves that your customers’ journeys with your company don’t change that much, that often, I’d still bet that your priorities change.

Some touchpoints along the customer journey may be necessary to make the customer experience more functional or efficient, while not being drivers of customer delight in and of themselves. But in time, these touchpoints, sometimes referred to as “experience hygiene,” may become more important to customers and grow into moments of truth. Similarly, factors that are loyalty drivers at one point in time can lose their importance for customers as the world changes.

It all changes based on the natural heartbeat of our businesses, our customers, and the markets we serve. Losing sight of new priorities or moving targets for optimization may create, at best, avoidable inefficiencies and, at worst, significant market setbacks. If we don’t stay up to date, we allow our competition to seize customer relationships, market share, and profits that should have been ours.

I’d like to strongly urge you to consider the best practice of frequently refreshing to your customer journey mapping work. Perhaps we could also consider, as the title of this post suggests, renaming our process – from customer journey mapping to something with a sense of repetition and continual improvement, like customer journey management. Doing so sends the right message about the process being “alive,” and suggests the need for the continual reprioritizing and frequent critical visits that will benefit our programs.

Let’s refocus on our takeaways: changing our old process of thinking about the map as an artifact to considering the fact that the journey has a heartbeat and is alive with change. The more clearly we understand this, the better the experiences we will create for our customers. Those customers will reward us long into the future with their wallets and their loyalty.

Recently I completed a customer satisfaction survey for United Airlines after a particularly bad experience even by airline standards.

I actually wanted to be contacted by the airline, but there is no place in their survey for a hot alert (request to be contacted). Instead at the end of their survey it says, “Comments or issues on a particular travel experience requiring a response or resolution should be submitted through the appropriate department as listed on our Contact Us page.”  Whoa! The survey is not being conducted to address any issues I might have had? Why am I doing this survey anyway?

All bad jokes aside, this is a very good question.

Customer satisfaction surveys are used for several different purposes, each of which is important to the company that wishes to continuously monitor and improve the customer experience they provide. Top objectives include:

  1. Fix any meaningful problems that have occurred for customers with the company’s products or service.
  2. Assess the performance of its customer-facing units (retail locations, call centers, digital care team, etc.) and staff (salespeople, call center reps, etc.).
  3. Improve its processes and standards for delivery.
  4. Understand customers’ needs as they use the company’s products or services so the company can help them have a better overall experience.

If you have read any recent blogs I’ve posted, you know that I’ve written a lot about Number 4 on the list, as it has been an area of customer experience that’s been largely ignored by customer experience management programs.  Increasingly, customers want companies to engage with them differently, treat them as individuals, and show they are valued throughout their journey.

Clearly, the United survey is not geared towards understanding my needs or helping me have a better overall experience with them, nor is it trying to fix meaningful customer problems, which in and of itself is pretty astounding. That said, I can clearly see in its construction that it’s likely geared toward Numbers 2 and 3, assessing performance and improving processes. Make no mistake, I am in no way saying that these objectives are not important. They are. As a customer, I’m glad that a company cares about coaching and training its people and fixing processes. However, I am a lot less glad if they aren’t dealing with my problems and don’t seem to care about me as a customer.

An effective customer experience program will address all four of these objectives. To do this, a company may need several different but integrated components. Effective measurement of processes and performance of people requires a focus on transactions and traditional measurement that uses a consistent and robust methodology, whereas a focus on customers as individuals requires a unique and individualized approach that follows a customer periodically throughout his or her tenure as a customer.

Any contact with a customer is an opportunity to identify any issues or problems that customers are experiencing and correct them.

Whichever kind of engagement the company is having with a customer, it should be clear why the customer should care and how it will return value to them. If United told me it was to improve performance and gave me examples of what they have done with survey results, I might better understand why they ask the questions they do and understand why I should continue to complete their survey each time I receive it.

Following customers throughout their journey and helping them prospectively is a new imperative. Traditional transactional satisfaction studies remain important but should be updated and integrated with this new and important objective.

Has your company adopted a comprehensive customer experience measurement and management approach? Tell me what you think.

By the way, has anyone been delayed 3 hours at a major hub when their pilot just didn’t show up even though he’d just landed there from another city? Just thought I’d ask.

Feedback: Bagels and the Art of Real-time Customer Listening

Feedback is a powerful concept. The word itself sets you up for improvement—even success. And, so, for your online business (as a software-as-a-service (SaaS) provider with customers, a blogger with an audience, or an e-commerce product with a market), you want to solicit—heart-in-hand—feedback.

Feedback is a powerful concept.  The word itself sets you up for improvement—even success.  And, so, for your online business (as a software-as-a-service (SaaS) provider with customers, a blogger with an audience, or an e-commerce product with a market), you want to solicit—heart-in-hand—feedback.

Getting Enough Responses

You are looking for feedback in any form:

Great, small, lean, prolific.

Negative, positive, optional, specific.

Feedback from fathers, mothers, uncles, cousins.

Feedback by tens and dozens.

Use a feedback tool that increases the likelihood that your audience will respond.   That is, for your SaaS app, blog, or e-commerce site, don’t use email surveys—ask for feedback inside your product.  Email surveys can hope for open rates of 20% and even lower response rates.  In-app surveys regularly achieve response rates of over 40%.

Context is Everything

In-app NPS Wootric
In-app NPS Wootric Survey

Feedback is nothing without context.  Read More…

Persuasive Survey Design

While browsing entertainment options on a 10-hour trans-Atlantic flight, I spotted a “feedback survey." Unfortunately, the feedback process quickly went downhill with too many clicks, questions I did not understand, and a lengthy feedback form. The designers of the form had failed to consider the feedback process from the respondent’s perspective. In my chapter Persuasive Survey Design in Allegiance’s book, Delivering Customer Intelligence, I discuss in detail how good survey programs designed from the respondent perspective can lead to higher response and completion rates and provide a more engaging, user-friendly experience.

While browsing entertainment options on a 10-hour trans-Atlantic flight, I spotted a “feedback survey.” Included in the survey was my seat number, a valuable piece of information that could reveal more information about me. I wondered if and how the airline would use this content to gain insights and find patterns.

The airline was off to a great start by engaging me when I had time to ruminate and provide honest feedback. Unfortunately, the feedback process quickly went downhill with too many clicks, questions I did not understand, and a lengthy feedback form.

The designers of the form had failed to consider the feedback process from the respondent’s perspective. In my chapter Persuasive Survey Design in Allegiance’s book, Delivering Customer Intelligence, I discuss in detail how good survey programs designed from the respondent perspective can lead to higher response and completion rates and provide a more engaging, user-friendly experience.

My survey experience made me think about what key factors grab consumer’s attention and keep it. I immediately thought of B. J. Fogg, a leading proponent of respondent psychology at the Stanford Persuasive Technology Lab who developed the “Fogg Behavior Model (FBM)” to help our understanding of human behavior and how it can be applied to survey design.

According to the FBM, in order for a person to perform a target behavior, he or she must be sufficiently motivated, have the ability to perform the behavior, and be triggered to perform the behavior—all at the same time. Core motivators include sensation (pleasure/pain), anticipation (hope/ fear), and social cohesion (acceptance/ rejection). These are essential for perceived respondent experience.

For example, surveys that include awards increase motivation and the likelihood that respondents will complete the survey. Also, the simpler a survey is, the more likely people are to respond. Once you have persuaded the user to fill out your survey, you should use the FBM throughout the three key stages of the feedback process—invitation, response and post response.

The target behavior for the invitation is to inspire the respondent to click on the link within the email or the feedback button on your site. One way to motivate users to respond to your survey is to tell them how their feedback will benefit them, such as improved products and services, rewards and coupons. For example, the airline I used during my recent trip could have motivated me more by giving away a few extra miles for survey completion and re-wording the button as “Give feedback, earn 1,000 bonus miles.”

Bottom line: Using respondent psychology and the Fogg Behavior Model to create simple, engaging surveys leads to higher response and completion rates. It involves keeping the survey objective and respondent experience in the forefront during the entire design process.

Tulsi Dharmarajan is Director of Product Management & Design for Allegiance

Marketing Myopia and the 21st Century Automotive Business

Redefining what an auto company does could be useful

It may seem like ancient history, but in a landmark 1960s article in the Harvard Business Review entitled “Marketing Myopia”, Theodore Levitt put forward the thesis that most companies take too narrow a view of the business they are in. He challenged executives to re-examine their corporate vision and take a wider perspective of the markets in which they compete. His argument was that organizations miss opportunities they are presented with simply because they fail to take a wider view.

An example he uses is the railroads whose failure to grow was due to a limited market view. The problem was that management saw themselves as being in the railroad business rather than the transportation business. There was a growing demand for passenger transportation but it was being filled by cars and airplanes, non-traditional competitors to the railroads. Management was railroad oriented instead of transportation oriented, product oriented instead of customer oriented.

Many credit Levitt with ushering in the era of modern marketing with many concepts we consider commonplace today. Levitt’s argument is that what usually happens is that management emphasizes selling, not marketing. The problem is that selling focuses on the needs of the seller, but marketing concentrates on the needs of the buyer. For companies to grow, he argues, they have to define their industries broadly to take advantage of growth opportunities. They must understand and act on their customers’ needs and desires, not bank on the presumed longevity of their products.

He says that an organization must learn to think of itself not as producing goods or services but as doing the things that will make people want to do business with it. And in every case, the chief executive is responsible for creating an environment that reflects this mission.

In the context of the automotive industry, product is key and I am encouraged by many of the technologies that are being incorporated in new vehicles being launched since they do seem to address genuine needs that customers have told us about. Who would complain about advances in safety, fuel efficiency, or navigation?

But a different perspective needs to be established, and this perspective must be squarely focused on customer needs. Does any new technology considered for a new model truly address a need that customers have or is it just cool technology that the engineering department has come up with? (Just so you don’t think I’m throwing engineers under the bus, I’m not. My brother and uncle are engineers and our son is currently studying to be one too!)

And in a wider context, do CEOs define their business as being in the car business? Or, taking a page from Levitt’s book, should it be defined as being in the transportation business? Defined in this way, it has the potential of broadening opportunities that CEOs will pursue for the company.

There is benefit in dusting off the old business management articles and books that we may have dismissed simply because “they’re too old.” Often the writers have already thought and written about business issues that we’re facing today and if we can learn from their insight and experience, then so much the better.

What do you think? Should manufacturers “stick to their own knitting” or should they consider seeing themselves as being in the transportation business, and not just the car business? Tell me what you think.


Change Region

Selecting a different region will change the language and content of pearl-plaza.ru

North America
United States/Canada (English)
Europe
DACH (Deutsch) United Kingdom (English)
Asia Pacific
Australia (English) New Zealand (English) Asia (English)