General Archives – Page 8 of 12 – Pearl-Plaza

Most comprehensive customer experience programs are made up of several different types of studies, the two most common of which are Transactional and Relationship studies. Here we will describe the differences between these two types of studies.

Transactional or trigger-based studies are the base of most customer experience programs. This type of study is conducted among current or recent customers and is used to ascertain the customer experience for a specific transaction or interaction. This type of research looks at near or short-term evaluations of the customer experience and often focuses on operational metrics. 

In contrast, the relational or relationship customer experience study is typically conducted among a random sample of the company’s customer base. Relational customer experience is used to understand the cumulative impressions customers form about their entire customer experience with the company. Importantly, this type of customer experience research is often the chassis for ascertaining specific aspects of the experience important to predicting loyalty and other customer behaviors. 

A. Transactional Customer Experience

In a transactional customer experience study, we focus on the details of a customer’s specific recent transaction. For example: 

  • The respondent’s most recent visit to Wendy’s 
  • The customer’s visit yesterday to her local Deutsche Bank branch 
  • Last week’s call to the Blue Cross/Blue Shield customer service center 
  • The respondent’s visit, 10 days ago, to Nielsen Nissan in Chesterton, Indiana, for routine auto maintenance. 

The overall rating we ask is the respondent’s overall evaluation of the specific transaction (visit, stay, purchase, and service). The attribute ratings are also specific to the specific transaction. 

B. Relational Customer Experience  

A relational customer experience study is broader in coverage. Here, we ask about the totality of the relationship with a company. In a relational customer experience study, the questions relate to the overall, accumulated experience the customer has had with the company. So rather than ask about the timeliness of an oil change at Nielsen Nissan and the quality of that service, the relational survey would ask for the respondent’s overall perceptions of Nielsen Nissan’s services across all the times the customer has interacted with that dealership. 

The overall ratings are often overall satisfaction with the relationship as a whole, willingness to recommend, and likelihood to return. Attributes are similarly broader in scope. We would not ask the customer about her satisfaction with the speed of service for her last oil change, instead we would ask about her satisfaction with the speed of service she usually gets when she visits Nielsen Nissan. 

C. Sampling Differences Between Transactional and Relationship Studies

In addition to the content of the surveys, a critical difference between these two studies is the sampling frame. In a transactional customer experience study, we sample customers who have interacted with the company recently. This is also sometimes called “trigger-based” customer experience since any type of interaction with the company can “trigger” the inclusion in a transactional customer experience study. 

In a relational customer experience study, we typically sample from the entire base of customers, including people who may not have interacted with the company recently. A relational customer experience study is projectable to the entire customer base, while a transactional customer experience study is a sub-set of customers – those who have interacted recently. 

When leveraging customer experience information with internal information, transactional customer experience information is often linked to operational metrics (such as wait time, hold time, staffing levels, etc.). In turn, through the use of bridge modeling, transactional research is often linked to relational customer experience, which is then linked to downstream business measures, such as revenue, profitability and shareholder value-add. 

D. Recommendations for Relationship Surveys 

Survey Content: As mentioned above, relationship surveys are meant to measure the totality of customers’ experiences with a given company. They are also meant to determine how customers are feeling about the company NOW. It is important to note that customers overall feelings about a company (as measured in relationship surveys) are often NOT the average of their transactional experience evaluations. This is because different transactions, especially if they are negative, can have a much larger effect on overall feelings toward a company than other transactions. 

Most relationship surveys contain questions addressing: 

  • Overall Metrics such as Likelihood to Recommend the Company, Overall Satisfaction with the Company, and Likelihood to Return or Repurchase 
  • High-level brand perceptions 
  • Company service channels usage and evaluations such as store/ dealership, finance company, call center/problem resolution teams, etc. 
  • Product usage and evaluations 
  • Share of Wallet measures 
  • Marketing/communication perceptions 

Survey Sampling: Who, how often and how many customers do you need to survey? There are no hard and fast rules but remember the idea is to obtain a representative sample of your customers. With that in mind: 

Who to Survey: All customers (whether they are recently active or not) should be available for sampling. You also might want to oversample small but important groups of customers (e.g., millennials, new owners, etc.) to ensure that you receive enough returns to analyze these groups separately. However, if you do oversample you will need to weight your data back to your customer demographics to ensure representative overall results. 

How Often to Survey: While transactional CX research is usually done on a continuous basis, relationship studies are usually conducted once or twice per year. How often companies conduct relationship studies is usually determined by the number of customers available (i.e., are there enough to conduct the study twice per year?) and when and how often decisions will be made based on the findings. 

How Many to Survey: This is often the most frequent question clients ask and the basic answer is that it depends on what organizational level you need the results to be representative of. The good news is that if you are only concerned about making decisions on the entire company level, only about 1000 well-sampled responses is sufficient. For most large companies that is a very small percentage of their customers. However, if you want the finding to be representative of lower levels of the organization for comparison purposes (e.g., zones, districts, stores) or want findings to be representative of certain customer groups (e.g., millennials, minorities, long-term customers, etc.) calculations need to be performed to determine the number of responses needed for these groups. Unfortunately, as demonstrated in the chart below, as the population size (e.g., company customers, zone customers, store customers) goes down, the percentage of customers needed to represent that population goes up. For instance, to obtain +/- 3 percentage point precision for a population of 3,000,000 people you only need 1067 randomly sampled returns. That is just 0.04% of the population. For a population of 30,000 people, you need 1030 returns which is 3.4% of the population. For a population of 3,000 the number of returns needed drops to 787, but that is 26.2% of a population of 3,000. For a very small population like 300, you need returns from 234 people (78.0%) of the population. 

population survey

E. Summary 

Both transactional and relationship surveys are key parts of any comprehensive customer experience program. Transactional surveys are great for assessing the quality of specific customer touch points and making improvements in those areas. Relationship surveys allow for the assessment of the entire customer experience across all touchpoints and therefore more closely relate to customer behaviors such as loyalty, customer spend, and customer advocacy.

TELUS is Canada’s largest healthcare and IT provider. They are also the fastest growing national telecom. However, in 2016, TELUS’ CX program was fragmented. They set to work and less than 18 months later, they turned their CX program around and saved $1 million year-over-year which resulted in a 100 percent volume increase in feedback and 45 percent SMS response rate across 3,000 VoC users. By focusing their efforts on reaching more customers with proactive recovery, they have seen a $5 million-dollar opportunity in churn reduction.Their concentration on the user experience and a comprehensive customer follow-up strategy benefited their bottom line. In a recent webinar, Stavros Davidovic, CX Manager at TELUS, shared the details of their program and the numbers behind their CX efforts.

You Need the Right Team

In order to achieve the type of growth experienced by TELUS, having the right team is critical. This needs to be a dedicated internal CX team. Team members need to be empowered to remove barriers, improve timelines, and develop themselves and others as subject matter experts.

Furthermore, as a part of the internal CX team, there needs to be a passionate executive sponsor that challenges the CX team daily. Those that support the CX team in the organization also need to have fair access to resources. Cross-functional alignment is key. Having the right team is not enough, if a customer centric mindset is not ingrained in the organization.

Establish a Customer-Centric Identity

Having a customer-centric identity at an organization means that customer experience is considered at every interaction. At TELUS, the goal is to not only collect feedback and act on feedback, but to do it at every step of the customer journey. This allows for an always up to date pulse on how the customers are feeling, which enables to TELUS to act accordingly. Part of having a customer-centric identity is having a hub for all things feedback related. This allowed for TELUS to be more transparent internally, as well as provide a place for reference material and support. One important part of keeping a customer-centric mindset is to ask the right questions.

Ask the Right Questions

Customers may not give out the detailed feedback you are looking to find. That is why it is critical to ask the right questions. Not just asking the right questions but asking them at the proper key points in order to maximize the impact of feedback. By asking the right questions at key points, you’ll be able to keep your brand consistent, invitations timely and personalized, emphasize the value of feedback to the customer, and properly act on the feedback.

“Customers aren’t interacting with you because they want to, but because they have to. You have to be mindful of that.”

From Fragmented to First-Class

In just 18 short months, TELUS saw a $1 million dollar increase in annual savings, 100 percent increase in volume of feedback, an increased SMS response rate, and a churn reduction of $5 million by reaching 15% more customers. These results were due to establishing the right team that was cross-functional with an executive sponsor, establishing a customer-centric identify that put the customer first in every situation, and asking the right questions at the right point in the customer journey. These things allowed TELUS to slingshot their fragmented CX program to being world-class. For more information and If you’d like to watch the full webinar, you can do so here.

The sale of a product marks the beginning of a business relationship – a relationship that only becomes truly profitable through the service relationship that follows. Ideally, that relationship would last throughout the product and customer lifecycle. Dealer vehicle services, therefore, are not just something that you are obliged to offer customers after you sell them something: It is an essential part of a profitable, long term business model. Predictive maintenance (PdM) – as opposed to routine ex-post or preventive maintenance – offers companies the chance to fundamentally transform their service and business model. For that to happen, they must start seeing PdM not just as a means of collecting data, but as a vital tool for creating additional value in an active partnership with their customers. PdM combines the topics of service and digitization and opens significant new value pockets. But to turn this immense theoretical opportunity into solid reality, dealer service is obliged also to meet certain conditions. Above all, they need to understand that PdM, as a form of “Services 4.0,” is far more than just a question of routine oil change reminders.

Dealer service centers…at the center of the customer loyalty loop

There’s little question that, for the near future, all eyes will be on dealership service departments as the primary source of dealership profit. It’s about time! Service centers have been the primary profit producers for decades. But consistent service customer retention is the unit responsible for bringing those sold customers back for the next showroom sale. Thus the old saying that “sales sells the initial vehicle once, service sells the “all the rest” has never been truer.

The Evolution of the dealer Business Development Center (BDC)

In its day, the launch of the dealership Business Development Center marked a monumental change in the traditional retail auto sales model. Up until then, use of the telephone was left to the discretion of sales agents, who were trained and managed primarily to focus on face to face sales and the “now” transaction. The BDC marked the first formalized effort to improve on the phone skills that sales agents lacked. To be blunt…most dealer sales people are still ineffective on the phone.

When the BDC strategy spread coverage to the service center, that same focus on re-actively answering the phone, in the past was the norm. For far too many service center BDCs, that mindset is still in place today. Retail sales and service leadership speak positively about the importance of retention, but most of their efforts are still stuck in making the appointment for the “now” transaction. While autonomous vehicles and mobility seem to be the hot topic today, those realities are still years, if not decades away from the immediate needs of the day to day retail auto world.

“We are in the midst of seeing more change in the next five years than we’ve seen in the last 50 years.” Mary Barra, General Motors CEO

The connected car and predictive maintenance are the “next big thing”

Autonomous vehicles and mobility are still years off from attaining meaningful scale. Far less coverage is being dedicated to the “connected car”…with the promise of replacing mileage-based maintenance recommendations with predictive certainties. Vehicle telematics have the ability today to alert the owner of a potential breakdown ahead of the occurrence. I spoke to this opportunity in this Cafe post earlier this year. And I followed it up by this post signaling that today’s service center was not near ready to deliver those predictive alert.

So the technology part of predictive data delivery is available, but the delivery of those services at the dealer end is far from being in place. Dealer service BDCs are not equipped, both in the BDC agents’ capabilities and front line culture to deliver the interface to the end user customer.

Service BDC agents, like service center front lines, are still stuck in a reactive, “after” the breakdown culture

It’s hard to change the culture of any department in a dealership! But consider this: if service BDC agents are challenged simply to convince customers to make appointments for preventative, routine maintenance…won’t they be even more challenged to persuade customers to schedule service before a breakdown occurs? There’s a great deal of difference between scheduling inbound appointment calls and that of an outbound call attempting to convince a vehicle owner to schedule a service that will specifically prevent an impending malfunction before a breakdown occurs. Customers are inherently suspicious of dealer service preventative mileage recommendations…convincing them of predictive maintenance will be a new challenge altogether.

A new script and higher skill set for BDC agents

While service customers are familiar with mileage-based oil changes, they don’t always act in a timely manner to take action and bring the vehicle to the service center. Presently, BDC agents use repetitive calling to nudge customers to act. In other words, they focus more on reminder calls and less on persuasion skills to motivate the customer to act now.  But relying on a repetitive call model won’t be effective for the future of “predictive maintenance.” Service centers will have to either train or recruit to a higher agent skill level in the future. Repetitive “reminder calls” won’t convince customers to act on a maintenance service they don’t understand. Agents must be believably persuasive to a level not practiced today.

And scripting will undergo dramatic changes as well. Repetitive “friendly reminder” calls will not be effective for owners who cannot visualize the benefit of a service that will specifically eliminate breakdowns before they occur.  That call messaging will center on the agent’s ability to connecting with the “feelings” of the vehicle owner.

Service BDCs evolve from “cost/expense” to the “revenue/profit”

Most dealers are still using an antiquated P & L strategy, where sales receive all of the credit (and marketing budget) for the first sale, but for repeat sales as well.  However, a high percentage of those repeat sales are the result of the positive customer experience delivered by the service center.  Past customers usually don’t return for the next vehicle purchase if their service experience was unacceptable.

As customer experience manager for a large GM dealer, I was included in the weekly marketing meeting where tens of thousands of dollars were spent every month for attaining new customers.  However, in all of those meetings, I never heard one mention of allocating any of those ad dollars to the service department for “retaining” repeat vehicle purchases.

Hopefully, the successes achieved with predictive maintenance will clarify even more that sales sells the first vehicle…and the positive experience delivered by the service center sells the rest.


You’ll never see a dealership Google image that isn’t like the one above—a smiling couple, seemingly happy with their experience of buying a vehicle. But are car buyers really that happy with the sales experience they receive, or happy to have it behind them?

Are they still smiling with the dealership experience after the initial sell? Did the sales staff properly introduce them to the next phase of their dealership customer journey, the service center? Was their “service experience” with free maintenance and warranty work after, well delivered? Did the follow-up experience after the sale consist of the typical, but dated, dealership follow up email of “congratulations” and maybe even a birthday card before they were receiving “pitches” for their next vehicle purchase?

Ask most any dealer principal or general manager and they’ll tell you that customer retention is front and center on their list of priorities. But with many dealers, when you measure the dollars formally allocated towards customer retention, those numbers are usually nowhere to be found.

Where are the Customer Experience Dollars?

As Customer Experience Manager for a large automotive dealer, I was fortunate enough to be invited to weekly advertising meetings between our leadership and ad agency. The purpose was to discuss what worked, what didn’t work and what was ahead.

But never, in all those weekly meetings, over almost three years of attending, did I ever witness one discussion about retaining past customers. There was time spent discussing community events, but no time spent on a formalized strategy for retention.

What was discussed? Facebook, YouTube, Snapchat, Pandora, Instagram, television, radio, on-site remotes, and even newspaper to the tune of tens of thousands of dollars spent each month on “getting them” and not one formal dollar designated for “keeping them”.

It is assumed in far too many dealerships that a respectable majority of past buyers will return because of the warranty or the free first maintenance offered by the manufacture. But after that, at roughly three years for leases and five to seven years for vehicle purchases, research reveals they begin to go elsewhere for service, mainly to an independent repair shop or franchise.

The Typical Dealership Sales Model

Typical dealership purchase funnel

The sales funnel has been used in retail auto for decades, but where is the “retention” part of the model? Many dealers would answer that they have their have their own rewards program for retention, but is it a rewards program that provides surprise and delight on a continual basis? Or like most dealer rewards programs that only apply discounts on products and services? What’s surprising and delightful about that?! Will that be enough reason for the client to return if the previous sales or service was poor?

Candidly, most dealer “experiences” are transactional. And when the showroom sale is completed, and the vehicle is delivered to the customer, most of the focus is on the next prospect (new prospect generated by ad dollars). Dealership retention efforts are mainly focused on the experience of buying and servicing the car, but will that top-of-mind awareness remain in the vehicle owner’s mind three years later when the lease is up? Will it trigger an initial contact with that car buyer to return to that same store five to seven years later when the vehicle owner starts a new car search?

The Loyalty Loop: an inclusive model for sales and retention

The Loyalty Loop

Photo Credit:McKinsey

Where is “the funnel” for client retention? Where is a formalized model for dealer retention of past customers? The Loyalty Loop was developed by Mckinsey and Company, a top consulting company used by many of the country’s top companies. But look how it focuses on a loyalty loop inside the traditional sales model. That inside loop consists of what the customer experiences with the dealer between car purchases.

While rewards programs are better than nothing, those rewards are not what I would call surprise and delight. They also offer discounts that involve coming to the dealership. Even though we know that vehicle owners are usually not surprised and delighted to return to the dealer for most anything.

Here’s an example of surprise and delight. Some dealers give FREE car washes as a retention tool.  All the owner needs to do is come to the service lane to redeem it. But most customers don’t want to come to the dealer for anything. How about this, give them a free “mobile” car wash.  Now that’s surprise and delight!

The Ownership Retention Gap

Consider these NADA statistics with respect to the retention of previously sold customers:

  • Dealers spent an average of $7.00 on retaining their already sold customers (2017)
  • Luxury dealers spent an average of $762.00 on each vehicle sold, non-luxury spent $670.00 (2017)
  • Average gross on referral vehicle sales was $1,200.00 vs $817.00 for fresh “ups”
  • Referrals have a 51% service usage vs 29% for fresh ups
  • Referrals have a 96% CSI score vs 73% for fresh ups

What’s is wrong with this picture? Far too many dealerships are ignoring their past customers who would be more loyal, produce more gross per vehicle, send referrals, deliver higher CSI scores and use their dealer service center more often than “newsuspects” who consume most all of the monthly ad budget for dealers.

We’ll expand on this topic in our next post.

The Power of a Smile

You often hear of the positive power of a smile.  A recent business trip brought this to light to me, as well as the negative power that is portrayed when it is missing.  My colleague and I were on our way to see a client and we decided to stop and get a coffee. The first coffee shop we came upon is a nationally well-known one, and especially here in New England—and even especially more in Quincy, MA.  It was a long drive and we still had a way to go.  We were really looking forward to a nice coffee and having optimistic discussions about our upcoming meeting.

As we approached the counter, we were ignored for about minute while several employees chatted a bit amongst themselves.  Of course, one minute can feel like ten when you are standing there awkwardly waiting for someone to acknowledge your presence.  However, we patiently waited until the representative made eye contact with us.  With no smile or greeting whatsoever, and with a clearly visible “I hate my job” look and tone, she said to us “What would you like?” We ordered, and once we got back to the car with our coffees, both looked at each other and at the very same time said “Wow!”.  We could not believe the lack of customer service and left there feeling like we were a bother and not wanted.  Why would we ever go back there?  The answer is we wouldn’t, and we won’t.  While the coffee was decent, the service certainly wasn’t.

As we reached our destination, we again stopped for another coffee, this time at another equally and nationally well-known coffee shop.  That experience was the complete opposite.  We were greeted with a smile, asked how our day was going, and how they could help us.  We felt acknowledged, invited, appreciated, and left feeling quite pleased and positive.

This experience reminded me of a great article I read a few years back called, “4 Reasons Why Excellent Customer Service Should Start with a Smile,” by Kaan Turnali in Digitalist Magazine. In the article, Kann explains that what’s often missing is a smile, a key element of customer service and business interactions.

Here are four reasons why excellent customer service should start with a smile:

A Smile is More Than an Expression

Smiling isn’t just something your face does. It communicates your state of mind. A smile—or the nonvisual sense of a smile for telephone customer service representatives—can be the most significant part of a business transaction. In retail, it can influence people’s perception of a brand and their customer satisfaction.

It can enhance the exchange of a product, the sharing of knowledge, or the offer of a solution As Internet and mobile commerce take market share from traditional brick-and-mortar businesses, smiling as a state of mind is more important than ever.

A Smile is More About a Mindset

Smiling is as much a reflection of an organization as it is a validation of that organization’s promise. It helps form the customer’s first impression, an indication of a pledge to offer a satisfactory product or service. It plays a role in everything we do, in every transaction we touch, in our relationship with every customer we help. It starts before we first interact with our customers, and it certainly does not end when the transaction is complete.

A Smile is an Attitude

Smiling tells our story beyond first impressions. It is a personal touch that extends our customer service promise and reflects our passion. Smiling says that we want to be here serving our clients and customers. It says that we are ready and willing to go the extra mile. And we smile even when we are not face-to-face with clients or customers. Our tone of voice on the phone and style of our correspondence communicate a virtual smile—or the lack thereof.

We cannot control everything that unfolds during customer interactions, but we always control the attitude we convey, such as amiability, energy and excitement, as well as commitment to satisfying the customer’s wants or needs. Even though a smile can’t solve every problem, in many cases, our attitude can triumph over many complications that can occur during the transaction and our smile can become a competitive edge.

Most Important: A Smile is an Invitation

Smiling sets a tone. It establishes a rapport and initiates trust, the cornerstone of every business relationship. This last point is more relevant than ever as we struggle to retain that integral factor in our fast-paced, smartphone-addicted, multitask-driven culture. Technological advances, globalization and new business models have us spending more time working remotely on our devices, which also makes us more remote.

Bottom line: Whether the transaction is business-to-business (B2B) or business-to-consumer (B2C), a smile is one of the easiest components to get right. Omitting smiles from the equation leaves out the crucial ingredient in any business interaction.

So, as we learned from the experiences I shared above, it takes more than a good cup of coffee to keep customers coming back.  Good service is just as important as a good product, and it all should begin with a smile.


Certified Customer Experience Professional (CCXP) Joe Camirand along with HorizonCX, LLC aims to improve operational and financial results for small and medium-sized businesses through Voice of the Customer (VoC) strategies.  Learn more at www.horizoncx.com

Placement of Survey Questions

This is an article written by MaritzCX in which the nature of survey questions are examined and connections to business results are illustrated. 

The placement of certain key survey questions – particularly the overall satisfaction question in a customer satisfaction questionnaire – has been extensively debated among academics, suppliers, and clients.

The point of view of MaritzCX is outlined below, results from discussion in our Research Leadership Council sessions, our Marketing Sciences Department, a review of relevant academic literature, and a limited amount of side-by-side testing.

Importantly, no overwhelming body of evidence indicates whether the key metrics in a survey, particularly questions like the overall satisfaction question, should come first (before the attributes) or last (after the attributes). Some studies have shown that the overall-last design produces higher relationships (R-squared) between overall satisfaction and the attributes, presumably because the preceding attributes influence the overall satisfaction measure through context effects. In fact, some suppliers recommend this “overall last” design for just this reason.

MaritzCX has the opposite point of view: We recommend the overall-first design to achieve the least-biased, best estimate of the real level of satisfaction that exists among a company’s customers.

Here is the rationale:

  • The goal of marketing research is to interview a sample of people in order to understand the entire universe of those people; for example, interviewing a sample of customers to represent all of the company’s (un-surveyed) customers. The goal is not to change customers’ perceptions as a result of having participated in the survey.


  • In any survey design, context effects from prior questions are unavoidable. The best survey designs eliminate or at least minimize context effects on the most important variables in the study. In general, the most important questions appear earlier in the questionnaire, thus minimizing respondent fatigue and bias from prior questions.


  • In customer satisfaction research, overall satisfaction is usually the most important measure in the study, the one on which compensation and other performance awards are based. Therefore, it should be sheltered as much as possible from context effects in the design i.e., placed early in the questionnaire.


  • If the overall-last design produces a higher R-squared or “driver” relationship between the attributes and the overall rating, this typically means that the overall rating is being impacted or changed by the preceding attributes. (Otherwise, there would be no difference between the two designs). Therefore, modifying the attribute battery could single-handedly produce a change in the overall satisfaction rating. Obviously, this is extremely problematic for a tracking study, in which attributes commonly change between the benchmark and rollout waves, or from year to year as company operational priorities change. Asking the overall satisfaction question first will allow clients to change the attribute battery at any time without this worry.


  • In an overall-last design, if the satisfaction rating is changed by preceding attributes, it may not have the same linkage to downstream customer behaviors (e.g., loyalty, advocacy) and/or business results that exists in the true customer universe. Thus, any modeling analyses undertaken could be mis-specified.

For these reasons, asking the overall question before the attributes appears to be the best under either scenario: If there is no context effect, then overall-first makes sense because it is less subject to respondent fatigue. If there is a context effect, then the overall-first design creates the least-biased, most stable and useful measure of overall satisfaction.

The preceding discussion applies to new studies, with no need to match prior historical data. For an existing study with an overall-last structure already in place, any potential advantages in switching to an overall-first design could be outweighed by the need to track historical trends as accurately as possible.

For more information about this article, click here.

MaritzCX believes organizations should be able to see, sense and act on the experiences and desires of every customer, at every touch point, as it happens. We help organizations increase customer retention, conversion and lifetime value by ingraining customer experience intelligence and action systems into the DNA of business operations. For more information, visit www.maritzcx.com.


Airport Analytics: SFO and Building a Better Delay

San Francisco International Airport is the gateway to the world's tech capital. In this installment of our airport review analytics series, we see how SFO effectively listens to its customers to guide billion dollar terminal renovations and make daily improvements.

In this series, we’ve been using text analytics to analyze the social media data around America’s busiest airports. In this installment, we broaden the scope to include Tweets as well as Facebook reviews. To begin, San Francisco International Airport is not having the greatest year. Over a six-month period, SFO had three near-miss aviation accidents, any one of which could have been “the worst disasters in aviation history” according to a Business Insider report. An editorial from the local Mercury News calling for “action” from the federal government reveals that over a 14-month timespan there were two additional near-misses. SFO has been called the “worst” airport to travel through during the holidays by the New York Daily News, and a 2012 study supposedly found that SFO was the “worst” airport in the country when it comes to delayed or cancelled flights.

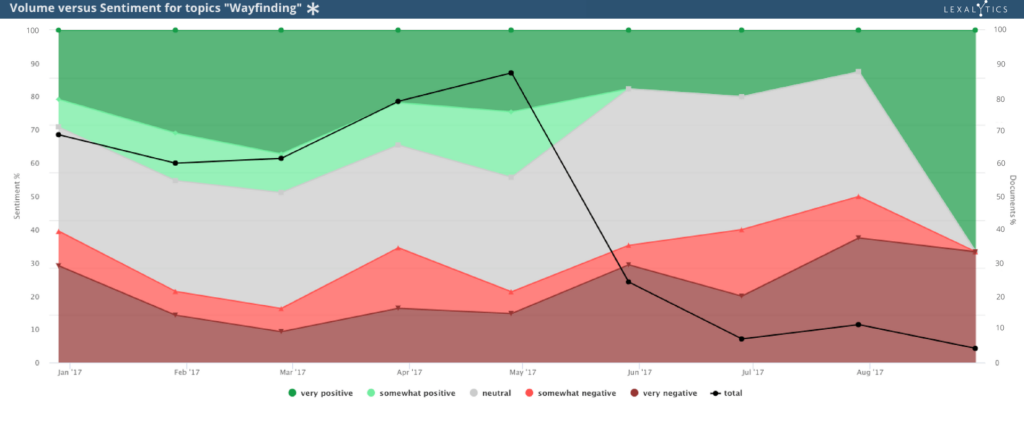
Nonetheless, upon closer inspection of the airport’s social media, it’s easy to see that stopping short at occasional bad press and travel column listicles gives only a fraction of SFO’s story; to wit, San Francisco excels where many other airports in this series fall down. As an example, take wayfinding, the architectural study of how people orient themselves in physical space and navigate from place to place. Airports are complex buildings to design. In premise, they must connect large, mixed use spaces through navigational cues intuitive enough to be grasped by cabin crew and children alike. Frequently however, the design falls short of effectively communicating with the subconscious. SFO is no exception, said one disgruntled traveler on Twitter in 2017: “Why aren’t there helpful signs here @flysfo?”

Social listening for airports

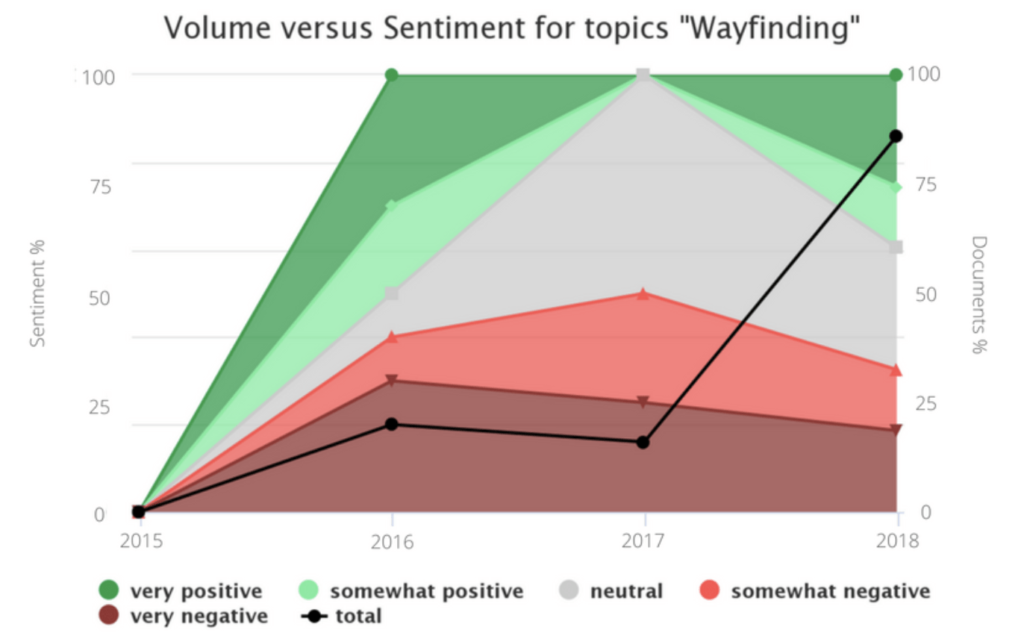
San Francisco International Airport actively listened to this feedback, recently pivoting a negative narrative into a positive one. “Yes, we do get comments from passengers [who find themselves lost]” said Judi Mosqueda, SFO Director of Project Management. In response, the airport allocated $7.3 million to remedy the problem throughout the 2.5 million-square-foot space. That was in January, and text analytics already demonstrates a positive customer feedback. One frequent flyer to the United States stopped by the SFO Facebook page to shower praise on the new wayfinding experience: “I find SFO to be one of the easiest airports in the USA to navigate,” they say. “Kudos to SFO for consistently providing a super travel experience!”

Sentiment surrounding SFO wayfinding trends positive over time

Building a better delay at SFO

San Francisco International, like all airports, can spark the ire of its customers when acts of nature foil schedules — perhaps more frequently than most, compliments to its fog, Karl. However, the airport aims to mitigate the stress of delays by investing in lounges, a yoga room, complimentary high speed broadband, museum installations, therapy animals, and more — all of which is represented in the topic sentiment present in the social data.

Booking-Scheduling suffers on account of frequent delays and cancellations due to weather. However, other areas, including amenities, internet, and food & drink quality trend neutral-positive, a win for the airport.

What is more, recent renovations to Terminals 2 and 3 set a strong standard for other American airports to follow. The social media data set is replete with praise for the new terminals, which boast sophisticated art exhibits, stylish seating areas, strong food vendor offerings, and evocative architectural features, with one reviewer describing the airport as “architecturally stunning.”

“Terminal 2 is probably the nicest domestic terminal in the entire country. Spacious, modern, clean and plenty of places to sit + free wifi!” says one reviewer. Another echoes this sentiment on Twitter, pointing out simply that “Terminal 2 is a class act!” Recently, a customer doubled down on this sentiment, urging SFO to begin similar renovations on Terminal 1: “Terminal 2 in SFO… best terminal by far in the USA. Can’t wait for the renovations in Terminal 1!”

While considering the design for Terminal 1’s renovation, which is estimated to be a $2.4 billion project, SFO’s stakeholders and the design firms they work with ought to dig even deeper into the text. Many of SFO’s review specifically target the airport’s facilities. A frequent target is the connector passageway between Terminals 2 and 3, or rather the lack of it. In 2009, SFO developed a connector passageway between the domestic Terminal 3 to the International Terminal. However, there is no way to navigate between the Terminals 1, 2, and 3 without exiting security. Says one aggravated guest, “I had to move from terminal 3 to terminal 1 and I had to get out one terminal and to get into the other one and I had to go through the already tedious, painful and unfriendly/brainless/rude TSA security checkpoint. Why don’t they have a way to move through terminals without passing security.” Being able to move freely between terminals, especially during a stressful delay or layover, makes a monumental difference in a customer’s experience at an airport.

Beating the competition by winning travelers

Text analytics helps airport stakeholders and travelers alike cut through the noise of editorialization by identifying the signal present within actual user data. With this technology, airports like San Francisco can better respond reactively — like in the case of wayfinding — while developing other proactive structural strategies to grow the customer base. What is more, SFO operates in a busy travel corridor where it competes with two other nearby airports, Oakland International and San Jose International, all the while protecting its market share from the behemoth in the south: LAX. This level of competition is not uncommon in the United States. As such, major airport brands need to get an edge where they can.

More from this series: airport review analytics

Series introduction: Analyzing Airport Reviews using Natural Language Processing

  1. Atlanta International has a big problem with “wayfinding”
  2. Charlotte Douglas can profit big by listening to their customers
  3. Chicago O’Hare needs to learn about viral reputation management
  4. Dallas/Fort Worth has a dirty secret
  5. Denver International may be a secret haven for the Illuminati
  6. New York’s JFK has to plan for the future
  7. Las Vegas McCarran doesn’t shy away from your vices
  8. San Francisco can teach us about listening to customers
  9. Seattle-Tacoma has a vocal customer named Jerry
  10. Los Angeles needs to master the “final mile”

Series summary: The Definitive Data-Driven Airport Ranking List

Weekends in my household are often consumed by time well spent with my wife and two young children, who enjoy everything from hide & seek and board games with crazy rules, to baseball and bike riding.  While I love these activities and the family memories they create, I too enjoy weekend time spent alone on personal projects around the house.  I call these “garag-ects”—projects generally accomplished in the garage.

Over the years, the bikes and sports equipment, toys and old ping-pong table, tools and materials have taken over my work space, each time requiring me to prepare a space to get started. It’s an unmotivating and incredibly inefficient environment, but I know that until I dedicate the time to organize the space required to tackle many garagectsin a single weekend, I will continue to lack the motivation and resources to engage in even a single item on the growing list of ‘to-do’ items.  In years past, I found myself able to fill a weekend with a list of accomplishments and was highly productive in the garage.  When I could start and complete a garagectin one sitting, I found myself entirely engaged in the process and motivated by the accomplishments each completion would bring.

Perception of Productivity Drives Employee Engagement

In this way, I have something in common with the vast majority of employees who work in any role across all types of industries and organizations.  Perhaps not just the family aspect or the growing list of projects in the garage, but the continuous intrinsic need to be productive in order to feel truly engaged.  In fact, research suggests that employee happiness and engagement at work is driven by the perception of productivity – an employee’s sense of being able to effectively execute his or her duties and role for the organization in an effective and efficient manner.  Coupled with the ability for an employee to see his or her contribution, the feeling of productivity is powerful in establishing and maintaining high engagement levels.

The social and physical environment for an employee in the workplace may be just as important as an organized garage when it comes to enabling a higher sense of productivity.  As organizations invest in employees by regularly asking for feedback and insight in order to make effective changes and promote a culture for employee-generated insights, it can be valuable to include measures that connect productivity and the outcomes of the work done day in and day out.

Bridging Concepts of Productivity with Employee Surveys and CX Measures

Many organizations are beginning to find ways to include such measurement within regular employee engagement surveys, where for example, employees are presented with specific items connecting the concepts of productivity while also bridging data between employee surveys and customer experience measures.  These items may cover processes & procedures and incentives, to goal-setting and technology, and might include items such as;

  • Our organization always acts in the best interests of our customers.
  • Our organization eliminates processes and procedures that interfere with best serving my customers.
  • Staff in our organization are given incentives to provide the best possible service to our customers.
  • My co-workers consistently think about how to better serve our customers.
  • Our organization hasformal programs and processes for improving customer experience.
  • Our organization sets specific goals for achieving and improving customer experience.
  • Our organization effectively uses technologyto deliver a consistently positive customer experience.
  • Our organization commits the resources required to exceed the expectationsof customers.

employee engagement diagram

Such measures offered to employees serve as a great way to connect traditional siloes between HR and CX Professionals who independently measure the employee and customer experience respectively and provide a mechanism for employees to weigh in foundational concepts affecting their work and the outcomes for customers.

Asking the Right Employee, with the Right Measures, at the Right Time

Another growing strategy organizations are deploying includes the use of employee experience (EX) surveys to monitor the more standard aspects of the employee life cycle.  This process includes asking the right employees, the right measures, at the right time – while they are top of mind and while the employee is most invested in a particular experience.  By measuring the initial impressions of an organization during the recruitment and hiring stages, through onboarding and acclamation, to communication and recognition, and typically ending with exit experience, an organization can identify employee-driven ideas for improving the experience in each of these areas affecting nearly all current and future employees.  These surveys can be administered in a more intelligent, automated fashion by leveraging employee record files to distribute certain survey types based on tenure, employment events (such as promotion or training) and communication processes by the organization, including quarterly townhall meetings. By including even just a single item on an employee’s perception of productivity, the organization can better identify quick wins across processes in the employment life cycle to improve this concept and engagement.

Make Sharing Experiences Easy

One other emerging trend includes the use of open-ended prompts, either as part of the regular employee survey process or as part of an open listening strategy where employees can share a story/idea at any time through a dedicated portal or open exchange.  Just as we do as customers when we experience something very positive or negative, employees also want to share their stories.  One positive and inspiring method is to provide a mechanism for employees to identify any instances where colleagues, processes, or the work environment allowed them to be overly productive and/or provide an exceptional experience to a customer.  Every employee has days where, from their vantage point they accomplish an incredible feat or series of feats in one day.  Providing opportunities for employees to share these stories will generate ideas for how to foster such productivity while recognizing employees for their accomplishments.  Such stories can even be shared publicly in electronic employee boards and in recognition mechanism across the organization to further drive engagement.

Speaking personally, I can physically feel the difference in my engagement when I’m in an environment that promotes focus and productivity.  Whether provided to me by the leadership at my place of work, or self-created in my garage, my working conditions including the processes, tools, space and people should foster productivity and be intentional in design to allow for my best work.  When this occurs, I’m most likely to remain engaged in my efforts and connected to the purpose of my work.  In my case, this means a weekend engaged in making my garage a more productive environment.

Airport Series: McCarran and Las Vegas

When an airport company reviews social data they need to be able to find the signal in the noise. Airports and the cities they serve are often confusingly interchanged on social media. In this article, we use filters and a custom configuration to see exactly what people are saying about McCarran International Airport.

Pop-quiz: what do you think of when you imagine Las Vegas?

Prostitution, gambling, hotels, and recreational marijuana might come to mind. But rather than fighting these associations, Las Vegas’ McCarran International Airport embraces them.

For example, the airport has “pot amnesty boxes”, where people can dump their legally-purchased weed in the event they’re traveling to a state or country with stricter regulations. And they’ve installed slot machines in the terminal, so travelers can get a jump on their gambling.

Or, as one Facebook reviewer put it, “try for one last hurrah.”

Figure 1: A pot amnesty disposal at Las Vegas McCarran International Airport

A city and its airport

However, this inextricable link between a city and its airport can pose a problem for a business analyst. For example, we recently sourced thousands of reviews from Las Vegas McCarran International Airport’s Facebook page. While analyzing this data set we discovered an interesting phenomenon: reviews on their Facebook page frequently criticized not just McCarran International, but also the city of Las Vegas itself.

Of course, listening to natural language reviews of Las Vegas is interesting. But it’s not useful for a business analyst tasked with understanding how customers experience the airport.

Finding the signal in the noise

To cut through the noise, we configured an analysis to extract what’s being said about McCarran International Airport based on reviews that mention both McCarran and Las Vegas.

To do this, we used Lexalytics’, an pearl-plaza.rupany, web-based dashboard, Semantria Storage & Visualization (SSV). SSV allows any business person to create configurations and run an analysis, even if they have no previous experience with data analytics.

Figure 2: Tuning a configuration in Semantria Storage & Visualization is a simple as point-and-click

To start, we used the SSV configuration builder. We can easily train the analysis to recognize sentiment in the text data set pertaining to other brands, such as the airlines flying into the airport, or even the city of Las Vegas itself.

Figure 3: By pulling out unrelated topics we can understand how people discuss elements related to “Las Vegas” the city, like “city infrastructure,” which might be confusingly lumped into the conversation about “Las Vegas” the airport

First, let’s take a moment to appreciate how the sentiment surrounding “vice” is only positive. In Las Vegas, it seems, vice is virtue!

Now, let’s pull this apart. In this data set, many customers complain about construction on the highway and roads leading to the airport. If our hypothetical business analyst working at the airport doesn’t configure their analysis properly, complaints about this roadwork may impact the sentiment score for McCarran. This will skew the results of the analysis, as civic works, like road construction, are outside the purview of the airport.

However, accounting for this can be tricky. Take this Facebook comment from March 2017, in which a customer complains about road construction:

“Our experience with the airport was overall great no problems at all I just don’t understand why car rentals can’t cooperate and have transportation inside the fence. Then there’s traffic congestion and detours everywhere. A 5 minute trip takes 15-20”

A properly-configured data analytics tool can split this review into its components.

For example, our own Semantria will sort this comment as positive for the airport, while identifying the other entities involved. In this case, “Overall great” adds +0.2 to McCarran’s sentiment score, while “car rentals” and “city infrastructure” get dinged -0.16 and -0.19 respectively.

Working with airport partners

Within any given airport, customers are exposed to numerous third-party vendors and agents. By tuning our analysis, we can focus on conversations about airlines, rental car agencies, and the TSA — all of which are operated by authorities independent from the airport.

Ultimately, these insights will help airport stakeholders share valuable intel with the brands that act as airport ambassadors every day. Furthermore, an analysis like this allows the airport to drill down into relevant conversations where they might affect change.

McCarran customer insights

Overall, analyzing Facebook reviews of McCarran International Airport shows us a mixed bag of opinions. There are some complaints about the cost of food and beverages (although we could say that high prices are inevitable, as the airport shares the retail concession with their restaurant partners, driving prices upward).

A whopping 48% of baggage handling reviews are negative, citing lost, damaged, or delayed luggage. If baggage isn’t delayed, the customers are. Many comments focus on out-of-service doors, people movers, and more.

Says one commenter on Facebook:

“Looked great with the Welcome to Vegas signs BUT couldn’t get to baggage collection as the doors were broken, no airline or airport staff or signage to say how to take a different route. You guys may know it, but visitors don’t!”

Speaking of signage, wayfinding is a consistent problem. As we’ve learned in the past, wayfinding is crucial to the success of an airport.

There are places where McCarran outshines the rest. In 2005, the airport became one of the first to provide complimentary Wifi. Thanks to an emphasis on network friendly infrastructure and regular uptime airline passengers are able to enjoy complimentary unlimited connection even while their on the tarmac. Stuck on a grounded flight? Now you may connect to an LAS branded wifi hotspot and while away the delay. This brand experience goes a long way in promoting customer retention. The emphasis on wifi as a customer experience touchpoint is something an airport company can suss out using text analytics. And, as we’ve pointed out with other examples, this intel can then be baked into the very fabric of the facility.

This fact is reinforced by Samuel G. Ingalls, assistant director of aviation, information systems at LAS, “By the time we started construction on our new Terminal 3, which opened in June 2012, we had a pretty good idea about where to place the Wi-Fi antennas for maximum effectiveness.” The work on expanding network connection onto the tarmac was put to a test in 2015 when 170,000 tech oriented conference attendees descended on Las Vegas. Mr. Ingalls and his team might’ve used text analytics to mine feedback about the experience of these power users, identifying any problem areas. “I saw many people around the airport with at least three devices.” reported Ingalls. “And we didn’t get any negative feedback from these attendees, who used the Wi-Fi system both inside and outside the terminal. I considered that a very positive sign.”

What should McCarran do with these insights?

McCarran might use this social data to design a 2019 budget aimed at solving problems real customers encounter every day. Natural language data is the single best resource for businesses to make profitable decisions. Now, with tools like Semantria Storage & Visualization, all stakeholders in a business may leverage this resource, even if they have no data analytics experience.

Editor’s note: This is a chapter from the ebook, Unlock the Value of CX. You can download the entire book here.

Most organizations strive to ingrain in their employees a set of organizational values–behaviors and attitudes–that are the guiding principles for all employee actions. These values are often expressed as brand promises–statements about what an organization is, what it stands for, and what it will deliver to its customers.

Brand promises can be implied as well as expressed, if customers are used to a particular level of service based on their previous interactions with the company. Brand promises work best when they are realistic and actionable, targeted to the organization’s customer base and clearly linked to every customer interaction across the organization.

Meeting Brand Expectations at Every Level

The ability to meet brand promises at every customer interaction, however, eludes too many organizations. Brand promises are often set from the top of the organization and performance metrics for executives are often tied to them. However, when it comes to brand behaviors being practiced at the point of customer interaction, the results are not always consistent or satisfactory. This causes some customers to leave the interaction disappointed and frustrated.

The problem is often magnified in companies undergoing changes. As organizations grow, they often reach a state where they develop competing priorities such as, a need to cut spending to reach profitability targets or a mandate to introduce a new product or benefit.

Executives often fail to question whether changes across the organization will impact their ability to deliver on the existing brand promise. The impact is not limited to marketing or product functions. Changes to any function should be considered in terms of its downstream customer impact. Every function, from marketing, product, risk, operations and finance to human resources and compliance, has a role in fulfilling the brand promise. Each function must own its impact on the customer experience.

Take for example, a bank’s underwriting department. As a result of a recent audit, is now required to perform manager-level reviews of a greater percentage of applications prior to approval. If the leaders collectively fail to ask for more underwriting managers, the approval timeline for applications will increase, and the trickle-down impact will likely be severe. If the product and marketing teams at individual branches are not informed about this change, customer complaints will begin to build and customer satisfaction will suffer.

Seven Strategies to Prevent Brand Erosion During Organizational Transformation

The solution requires ownership by the entire organization. Below are seven strategies to avoid setting brand promises that are untenable and avoiding brand promise erosion when organizational changes happen.

1. SET THE TONE FROM THE TOP. Brand promises are often built by a chief marketing officer or branding executive in conjunction with a branding agency. However, every executive function should be involved in this effort to confirm the positioning is feasible. Once alignment exists around the brand promise, the CEO must set the tone. It is imperative for employees to be empowered to deliver on the brand promise at every customer interaction.

2. APPOINT A CHIEF CUSTOMER OFFICER. A chief customer officer is part marketer, part ombudsman, part efficiency expert and part operations expert – and fully committed to the customer journey. The best CCO is often someone experienced across various functions who can support the customer journey design from multiple perspectives. This customer champion must be willing and able to converse with peers from across the organization to ensure alignment with the brand promises, develop and lead efforts to assess impacts on the customer journey, and influence every other function to achieve the end goal of delivering the brand promises.

3. DESIGNATE A CUSTOMER COMMITTEE. It is common for organizations to have corporate committees, often aligned with executive functions, to support efforts ranging from compliance to risk to finance. A customer committee, consisting of cross-functional senior executives, will similarly support the customer experience effort and provide it with the emphasis it deserves.

4. ENGAGE IN CUSTOMER JOURNEY MAPPING. Create a cross-functional team consisting of product, marketing, risk, technology, operations, finance, human resources and other key functions to engage in exercises that map the actual customer experience. This may include what customers are trying to do, what they are feeling, what is going on behind the scenes in operations and technology, what moments of surprise, delight or unnecessary friction exist, and which interactions meet or fail to meet the brand promises. Then, develop a target customer journey that meets the brand promises with the appropriate level of friction, and chart a road map to achieve it. Think about the impacts on people (customers and employees), process, product and technology. The customer journey map should be owned by the chief customer officer and each key stakeholder in the journey. It should be updated each time a change to people, process, product or technology is considered.

5. MEASURE CUSTOMER SATISFACTION AND CLOSE THE FEEDBACK LOOP. Many, if not most, organizations have invested in customer satisfaction monitoring of one type or another and implemented scoring methodologies with which to keep track. However, monitoring alone won’t move the needle on customer satisfaction. The keys to the success of customer satisfaction monitoring are 1) implementation of a feedback loop, and 2) understanding drivers behind changes in macro-level satisfaction scores. Qualitative information about a poor experience (a low score) from a customer is an indicator that something has gone wrong. When multiple survey responses are similar, that’s an indicator that a process is broken. It is important that organizations not only monitor feedback but also assign owners of the feedback loop for each key step in the journey. When a customer provides negative feedback, the journey owner must reach out to the customer, acknowledge the issue and commit to a response. They must then investigate, engage in internal communication, develop a plan to rectify problems (if needed) and follow up with the customer.

6. DEVELOP CUSTOMER SATISFACTION METRICS ACROSS THE ORGANIZATION. Companies should develop meaningful and consistent customer satisfaction metrics for employees that tie directly to compensation. A technology metric, such as system uptime for example, does not correlate to customer experience. Although system uptime is clearly a requirement for customer satisfaction, it is too narrow. Rather, develop organization-wide metrics that apply to all employees and allow them to relate the requirement to their own tasks.

7. LEVERAGE INDEPENDENT TESTING. Independent testing is crucial to ensure what you have prescribed is actually occurring. Independent testers should be given tasks tied to discrete journeys and asked to report back on exactly what happened and how they felt as a result of the experience. Additionally, testers should provide a fact-based method for comparing the interaction against the journey map and brand pillars, as well as qualitative feedback that uncovers gaps between the experience and the brand promises. Achieving excellence in customer experience is a result of every employee living the organization’s brand promise. Getting there requires significant enterprise-wide commitment, including the implementation of the steps listed above. In return it can reap significant rewards in the form of satisfied customers, happier employees, greater revenues and improved profitability.

Starting the post-sale relationship off right is key to customer retention.

While this can’t be emphasized enough, with regards to onboarding, be careful not to mistake giving customers more choices and information for a better process.

Too Many Options May Overwhelm Customers

Chances are that your sales team pulled out all the stops to attract the attention of your current customers. Customers are drawn to large numbers of features and options when making the initial purchase decision.

You would think that after they’ve closed the deal, it’s your job to explain all the details and nuances about everything they were promised in the sales pitch. It’s time to exceed all of their expectations. But when it comes to onboarding it is very easy to overwhelm them with all of those same options that originally attracted them to your product.

What is Choice Overload?

One of the basic phenomena in behavioral economics is choice overload, which occurs when you present someone with too many choices. It is associated with unhappiness, decision fatigue, going with the default option, and choice deferral.

By showing your customers all of the customizable settings, features, and options right at the beginning of your relationship, before they are familiar with you or your product, you run the risk of overwhelming them into inaction and dissatisfaction.

There are four key factors that contribute to choice overload:

  • choice set complexity
  • decision task difficulty
  • preference uncertainty
  • and decision goal

With a more complex choice set, a more difficult decision task, more preference uncertainty, or a more prominent and effort-minimizing business goal, there is a greater chance of choice overload. Poor onboarding is one of the leading causes of churn, so overwhelming your customers during onboarding can be one of the most impactful mistakes regarding your overall customer experience.

How User Interface May Contribute to Overload

Even if you channel your eager energy into the best onboarding process on the face of this planet, that may not be enough to prevent a different kind of overload, cognitive overload. According to experts at Fluid UI, if the user interface your customers are dealing with is too stimulating or even not stimulating enough, customers may “overlook the finer details of a product or service, lose focus or ignore an important learning moment. [Humans] still draw conclusions about the suitability of the product [they] are learning about.”

Read more about avoiding cognitive overload using customer-centric design for successful onboarding and retention.

Cyberpsychology and UX 3: Preventing Cognitive Overload

Your step-by-step instructions, videos, and one-on-one walkthrough conversations for onboarding will be negatively impacted if the web pages customers interact with are cluttered. If the instructional video/ help documentation is buried in an obscure corner of your homepage, you’ll find that your Success team spends too much time acting as Support.

Customer Effort Score: One Question to Combat Overload

The easiest way to learn if you have a problem is to gather feedback from customers who have completed onboarding. Both types of overload are easily identified when you ask customers “How easy was it for you to complete onboarding?”, the Customer Effort Score question. Asking for a score and comments will bring to light the most prominent issues at this journey point.

By gathering feedback immediately after onboarding, customers who struggled with the user interface will be able to provide you specific examples from their experience that need adjustment. For example, you may hear from a customer who is colorblind that the color theme for a specific chart was tough to distinguish for them, or that finding a specific button took more time than they had anticipated.

Read more about how Customer Effort Score can improve your onboarding process.

Use Choice to Enhance Customer Experience

Driving adoption and customer loyalty is a tough job, but flooding new customers with information is not the way to go.

Gathering feedback throughout your relationship about effort, satisfaction, and loyalty will help you improve the entire customer experience and prevent you from overwhelming your customers at any point in their journey with you.

To provide an excellent customer experience, all you need to do is provide convenient information that helps your customers achieve the next milestone, or inspires them to develop a new milestone. By listening and taking action, you build trust and loyalty with your customers that will help you win customers for life.

Measure and improve customer experience. Sign up today for free Net Promoter Score, CSAT or Customer Effort Score feedback with Pearl-Plaza.

Putting off changes to your onboarding process is too tempting. Where do you find the time to overhaul the entire process and where do you even begin? It feels like a monumental task that will take ages to do properly.

While it may seem daunting, there is a simple, quick step you can take to prioritize incremental improvements immediately: start gathering Customer Effort Score feedback after onboarding completion.

What does “Onboarded” mean?

Onboarding is a term often used in SaaS businesses and there are many ways people will define what “onboarded” means. It can vary depending on the type and level of complexity of your product or service.

As an event in the Customer Success journey, “onboarded” can mean the first point where customers start to achieve their goals. In terms of product training, it is the point where hand-holding is no longer necessary and customers are confident enough to navigate on their own.

Once you have a better idea of what “onboarded” means to your company, you can reverse engineer the process to get there.

The Easiest Way to Improve Onboarding

There are plenty of specific actions you can take when it comes to improving the onboarding process, but how do you know which actions to prioritize? You could write up a playbook for all of your CSMs, but how do you know what methods are the most successful, or what the most frequently asked questions during onboarding are?

Gathering Customer Effort Score feedback after your customers soon after they finish the onboarding process helps you prioritize initiatives when it comes to improving the onboarding customer experience.  Address the most frequent, most fundamental complaints first to incrementally change your onboarding process instead of trying to do a complete overhaul in one go.

What is Customer Effort Score (CES)?

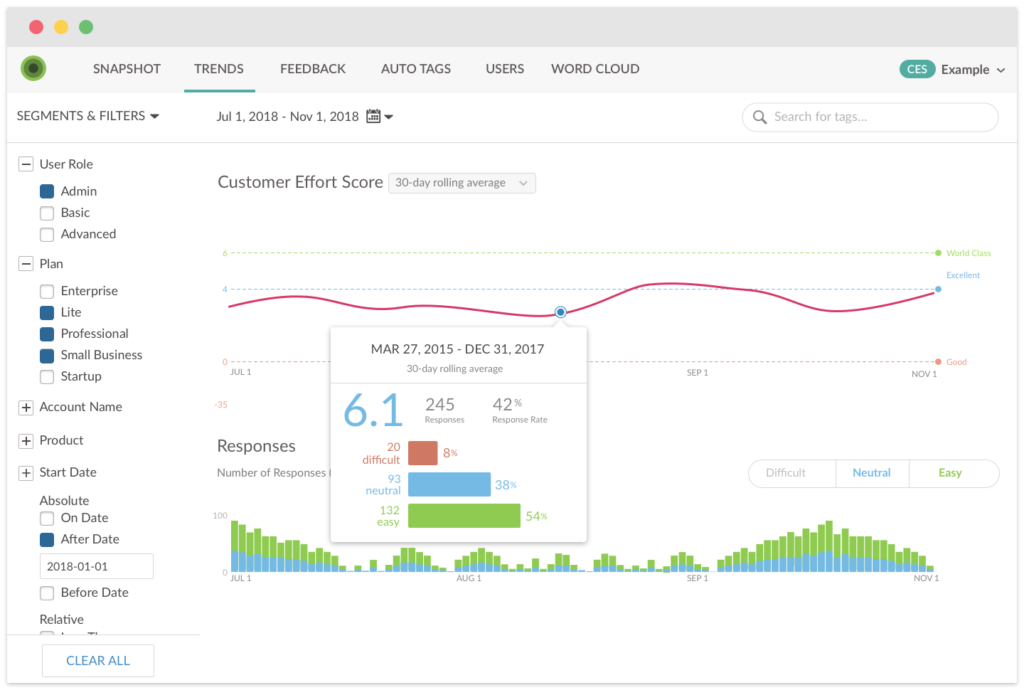
The Customer Effort Score survey asks customers on a scale from 1 to 7 how easy it is to deal with a companies products and services. The CES survey is a transactional survey, gauging the experiences customers have after a specific touch point in the customer journey.

Why Customer Effort Score (CES)?

Why focus on effort here? Why is it a better choice than, say, NPS? Because effortless onboarding correlates with retention. According to the Harvard Business Review, “companies create loyal customers primarily by helping them solve their problems quickly and easily.”

When you ask your customers directly – “How hard was it for you to get started with us?” you will quickly identify whatever obstacles your customers faced during onboarding. Address them immediately for quick wins with big impact.

Implementing a CES micro-survey means receiving open-ended feedback from customers that speak to the issues that are at the top of their minds. You’ll hear what customers struggle with specifically so that you can prioritize the changes and additions that will have the greatest impact on customer experience.

In the long term, CES can get you answers to the questions that shape your overall process such as:

  • What do customers need to be able to do or know to accomplish their goal?
  • What information do they need in order to do this?
  • Which content formats are best to convey different information?
  • What do your customers perceive to be the first value delivered point/ first value achieved point?
  • How long does it take customers to get to the first value delivered point/ first value achieved point and what can be changed to reduce that amount of time?
  • Is there information being lost in the handoff from Sales to Success? If so, what is being lost?

Focusing on minimizing friction and achieving your customers’ desired outcome encourages them to form a longer, deeper relationship with your company. This means more opportunities for upsell and cross-sell. It also means higher advocacy, which is instrumental to growth.

Iterate & Adjust as Your Company Evolves

By gathering CES feedback after onboarding completion, your company can improve retention and build a loyal customer base. You’ll demonstrate customer-centricity from the very beginning of your relationships.

Creating a customer-centric onboarding process kicks off a customer experience that will make you stand out among your competition. Even as your company and product evolve to accommodate new needs, customer feedback will guide you to the most effective onboarding process, helping you win customers for life.

Start getting in-app CES feedback for free with Wootric.

Change Region

Selecting a different region will change the language and content of pearl-plaza.ru

North America
United States/Canada (English)
Europe
DACH (Deutsch) United Kingdom (English)
Asia Pacific
Australia (English) New Zealand (English) Asia (English)